


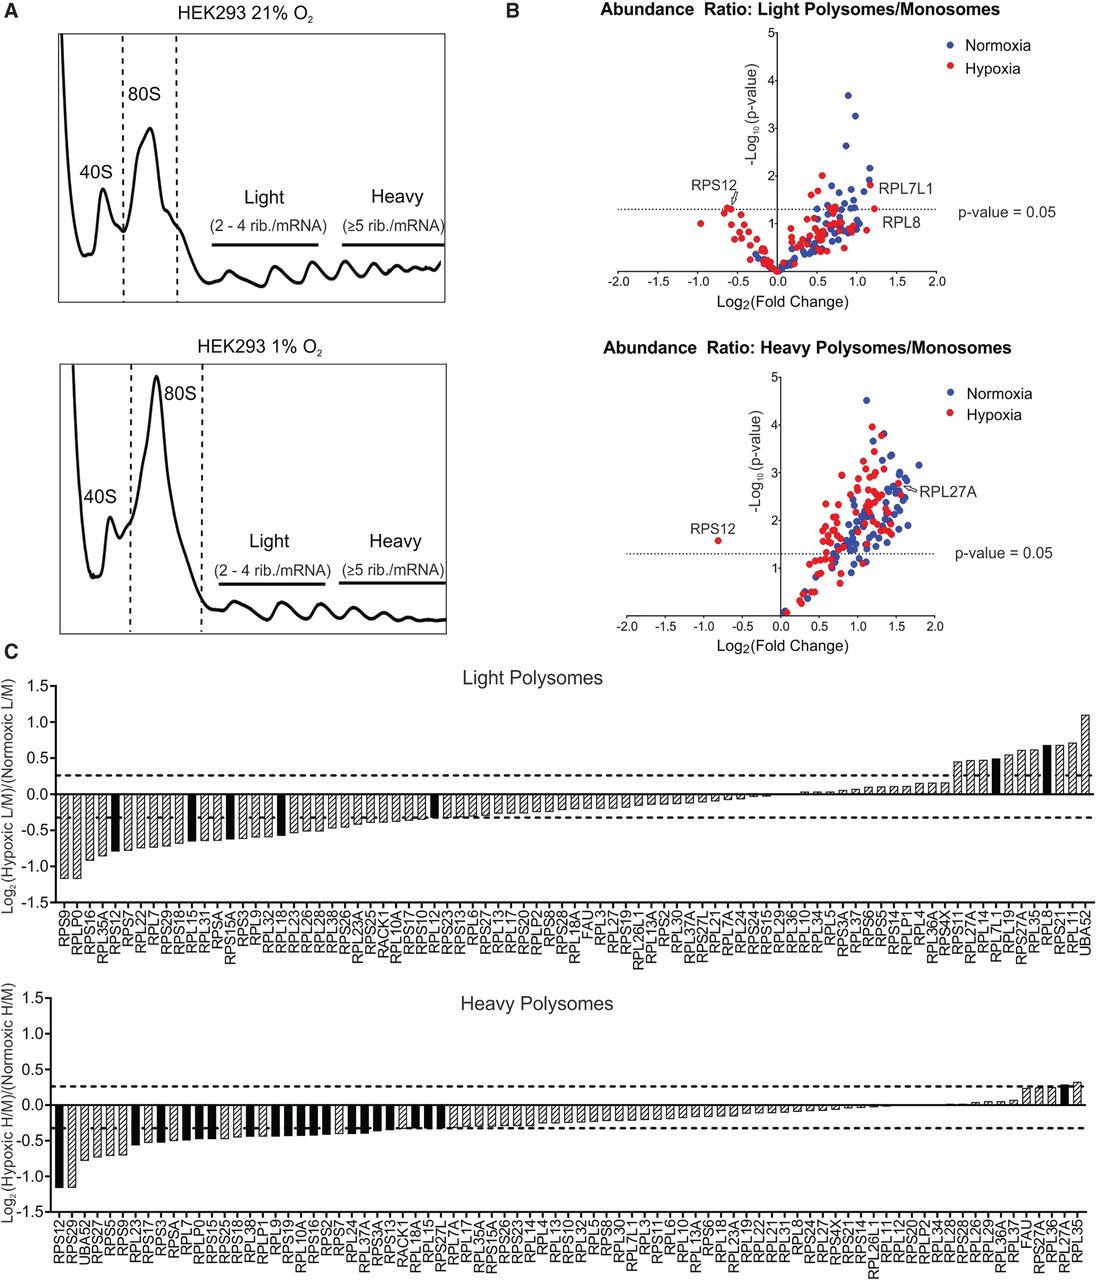
The abundance of four ribosomal proteins is altered in hypoxic relative to normoxic polysomes. (A) Fractionated ultracentrifuged cell lysates from HEK293 in 21% O2 (normoxia) and 1% O2 (hypoxia) were pooled into 80S monosomes (M; within dotted line), light polysomes (L), and heavy polysomes (H). (B) Volcano plot of the abundance ratio using the mean abundances from three biological replicates to calculate the L/M and H/M ratios. Dotted line represents P = 0.05 using two-tailed unpaired t-test. (C) The ratio of hypoxic L/M or H/M to normoxic L/M or H/M was calculated and represented as log2 fold change. Dashed line represents cut-off value of ±0.2 non-log2 transformed change in hypoxic L/M or H/M relative to normoxic (L/M or H/M). Solid bars represent proteins above this cut-off that were statistically significant in hypoxic polysomes relative to monosomes. See Supplemental Material source data file for Figure 1.




