


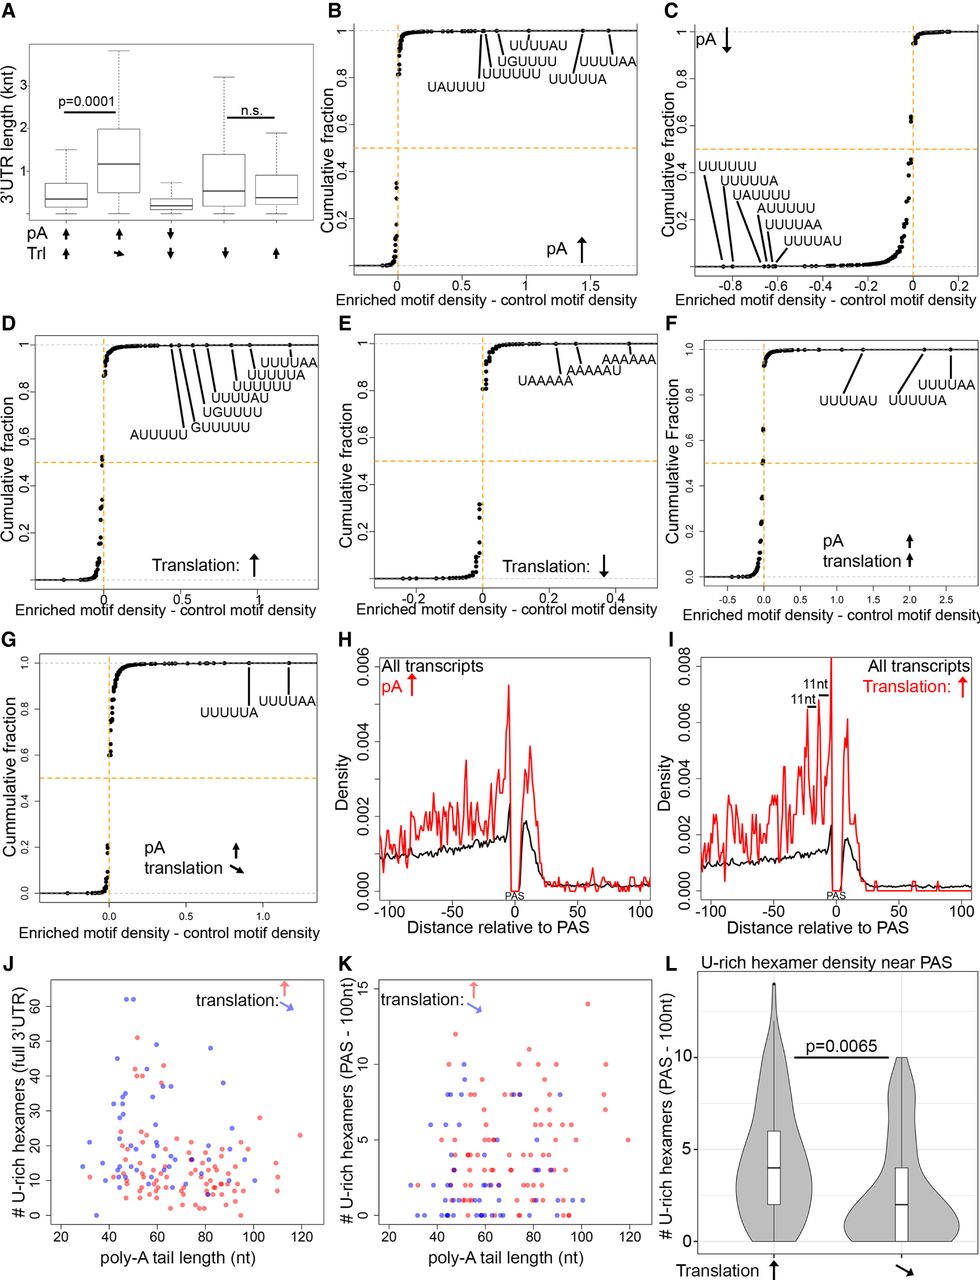
Primary sequence motifs are enriched in polyadenylated and translationally activated transcripts. (A) 3′UTRs lengths were measured from clusters of mRNAs exhibiting various polyadenylation and translation behavior. P-values are the result of a Wilcoxon rank sum test. (B–E) The density of all hexamers was calculated in the 3′UTRs of various sets of transcripts (polyadenylated [B], deadenylated [C], translationally activated [D], translationally repressed [E]) and in all transcripts. Cumulative distribution plots show the enrichment of various hexamers in different subsets of transcripts compared to all transcripts. (F,G) Hexamer enrichment was calculated in the 3′UTRs of polyadenylated transcripts that were translationally activated (F) or translationally repressed (G). Translationally activated transcripts exhibit a higher density of U-rich sequence elements. (H) The positions of the top 13 U-rich elements (from B) were compared to the 3′-most polyadenylation signal for all transcripts (black line) and adenylated transcripts. (I) The relative density of U-rich sequences compared to the 3′-most polyadenylation signal for translationally activated transcripts. (J) Scatterplot of poly(A) tail length (at MII) and the number of U-rich hexamers in the entire 3′UTR for translationally activated (red) or repressed (blue) mRNAs. (K) Same plot as in J except that U-rich element density is only compared in the 100 nt 5′ of the PAS sequence. (L) Violin plot of U-rich element density in the 100 nt 5′ of the PAS sequence in translationally activated and repressed mRNAs. P-value is the result of a Wilcoxon rank-sum test.




