


FIGURE 5.
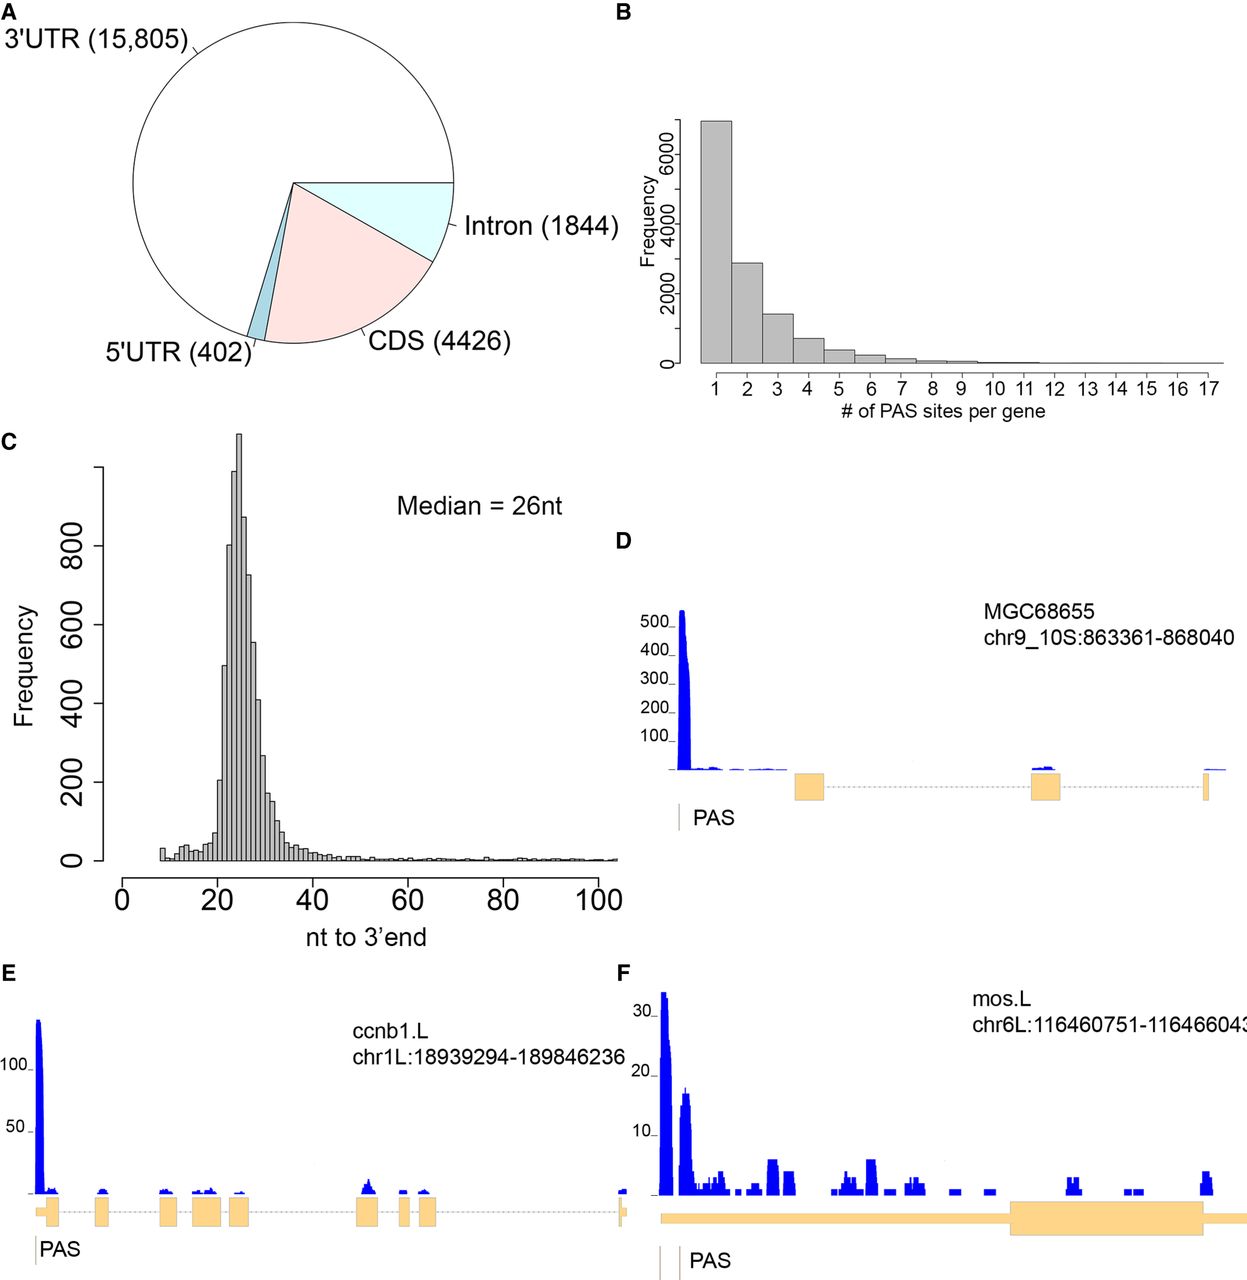
PAS-seq analysis of the X. laevis oocyte transcriptome. (A) PAS-seq was used to identify PASs in X. laevis oocytes. Pie chart shows the fraction of PASs mapping to each type of transcript feature. (B) Histogram of the number of PASs per gene. (C) Histogram of the average number of nucleotides from the 3′ most base of the polyadenylation signal (AAUAAA, AUUAAA) to the measured end of the transcript. (D,E) Genome browser views of PAS-seq reads compared to three genes. PAS calls are listed below each gene as thin bars.




