


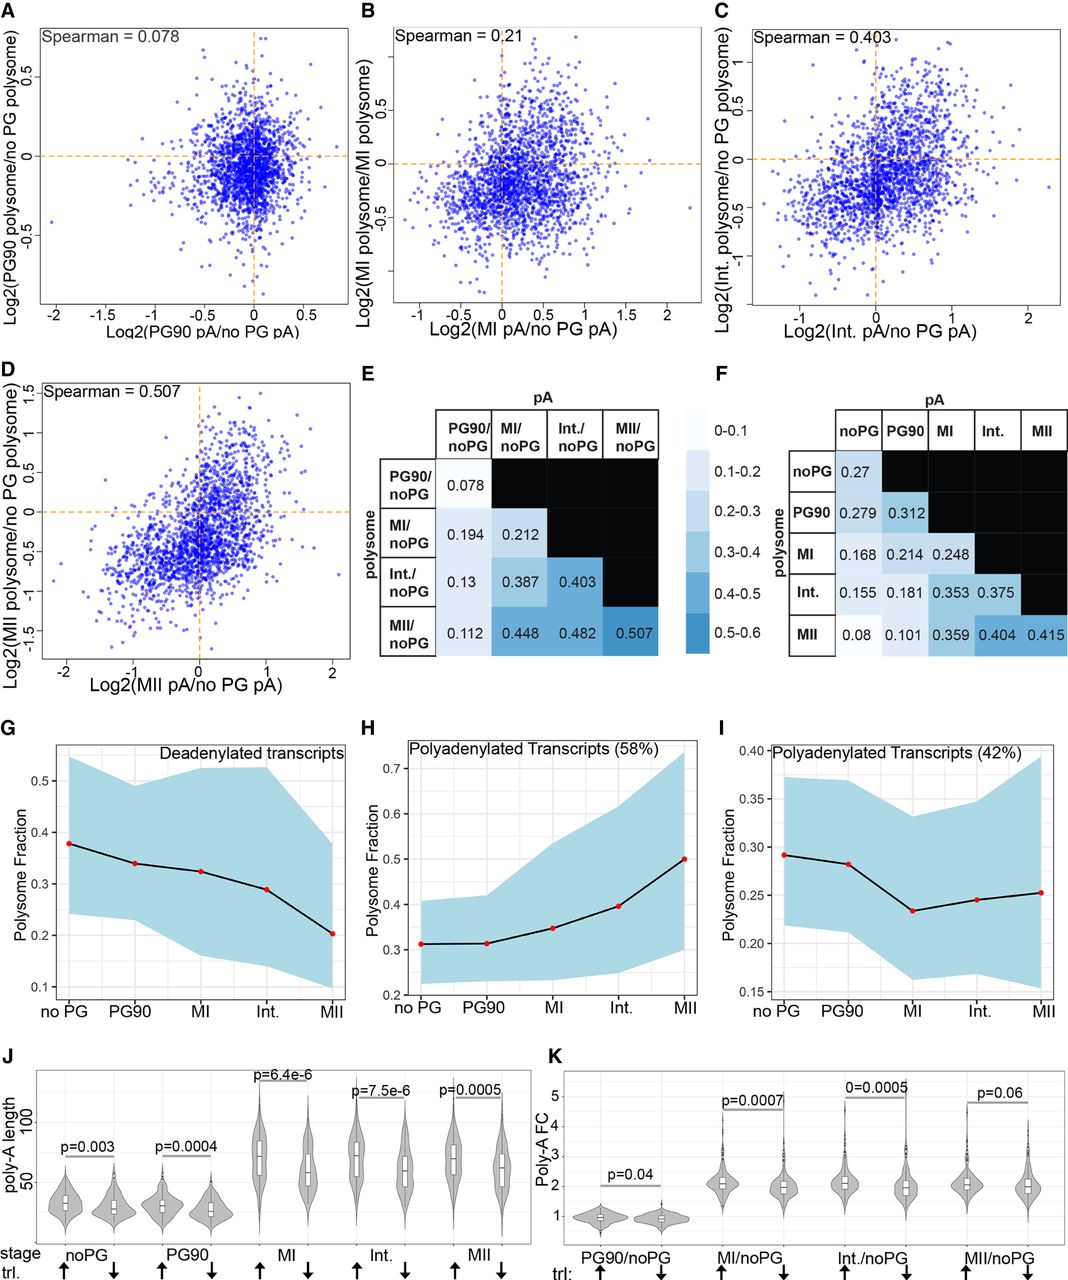
Correlation between transcript polyadenylation and translation. (A–D) Scatterplots of the change in polyadenylation compared to the change of the fraction of mRNA present on polysomes. (E) Spearman correlation coefficients between changes in polyadenylation and changes in mRNA fraction on polysomes. (F) Spearman correlation coefficients of raw poly(A) tail length and raw polysome percentage measurements. (G) The translation behavior of deadenylated transcripts (from Fig. 1H) was examined using STEM software. All deadenylated transcripts exhibited translational repression. (H,I) The translation behavior of adenylated transcripts (From Fig. 1G) was examined using STEM software. Adenylated transcripts were either translationally activated (H) or repressed (I). (J) Violin plots of the raw poly(A) tail lengths of polyadenylated transcripts that were translationally activated (up arrow) or repressed (down arrow). (K) Violin plots of the fold change in poly(A) tail length of adenylated transcripts that were translationally activated (up arrow) or repressed (down arrow). Indicated P-values are the result of a Wilcoxon rank-sum test.




