


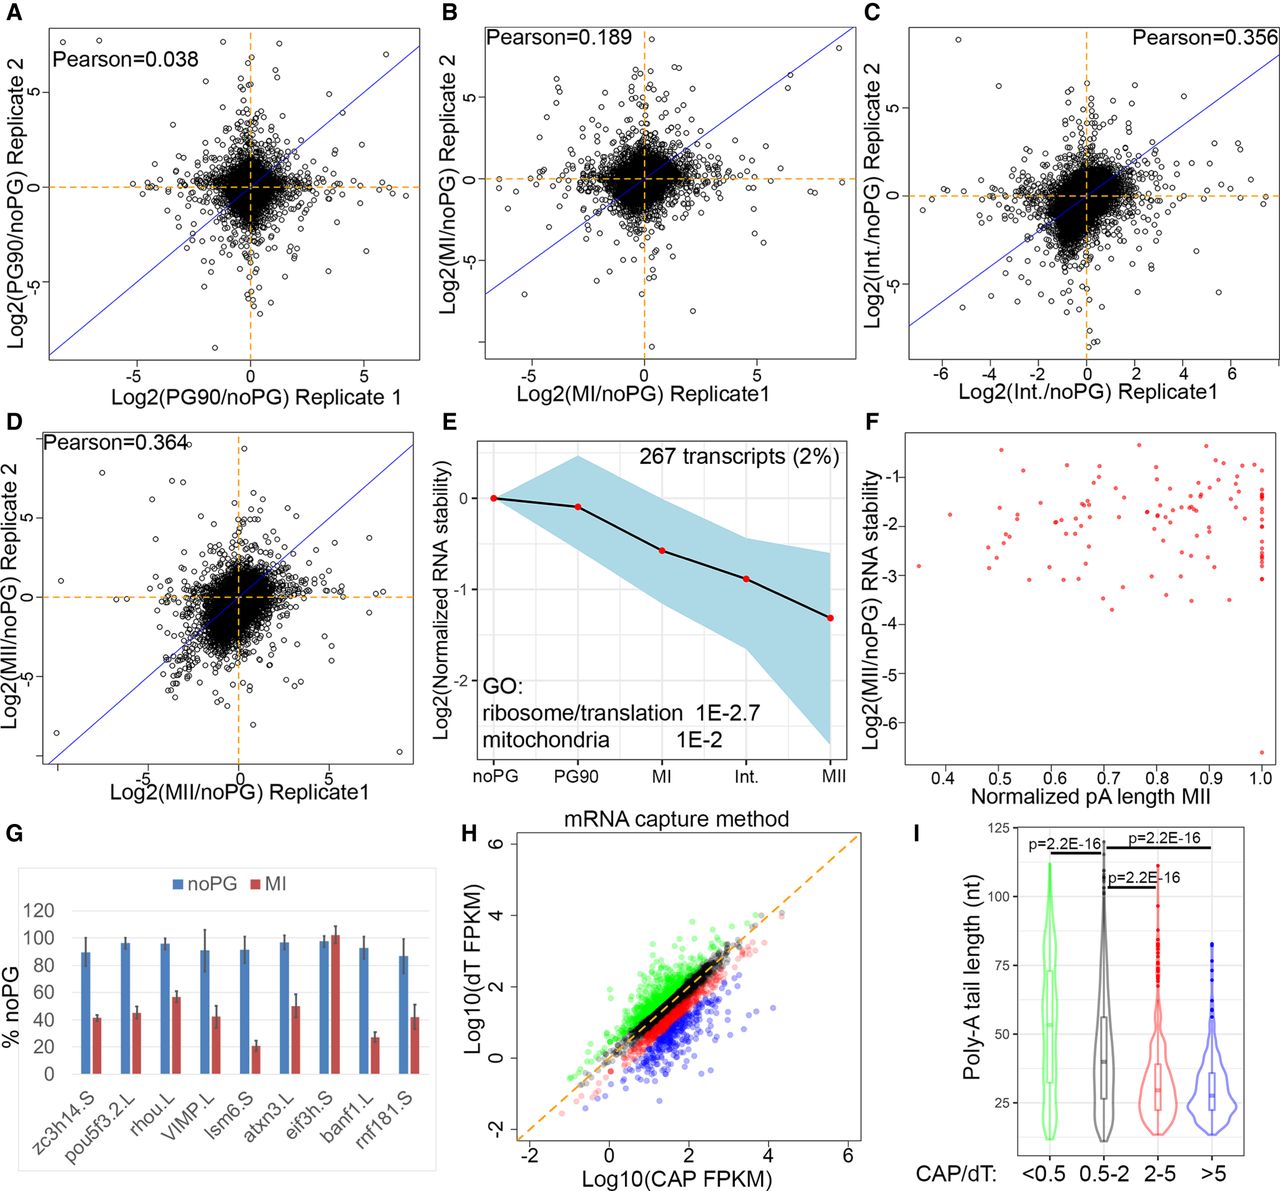
RNA degradation during oocyte maturation. RNA-seq reads from polysome gradients were pooled to create “total RNA” samples for analysis of transcript stability during oocyte maturation. (A–D) Scatterplots comparing two biological replicates of changes in RNA abundance during oocyte maturation. (E) STEM software was used to identify clusters of transcripts that were up- or down-regulated during oocyte maturation. One cluster of degraded transcripts was identified. GO terms enriched in this set of transcripts are indicated on plot. (F) Scatterplot comparing change in RNA stability for degraded transcripts (from E) to normalized measured poly(A) tail length. (G) Q-RT-PCR was used to measure the stability of nine transcripts predicted to be degraded from two additional biological replicates. We also tested several transcripts that were predicted to be increased during oocyte maturation and were unable to confirm any changes in transcript levels. Error bars indicate standard deviation after normalization to an unchanged transcript. (H) Comparison of RNA-seq abundance of mRNAs captured by oligo(dT) or Cap-capture from Blower et al. (2013). Transcripts are colored by ratio of FPKM between dT and Cap-capture libraries. (I) Violin plots of poly(A) tail length for each class of transcripts from H. CAP/dT ratios are indicated below the plot. P-values are the result of a Wilcoxon rank-sum test.




