


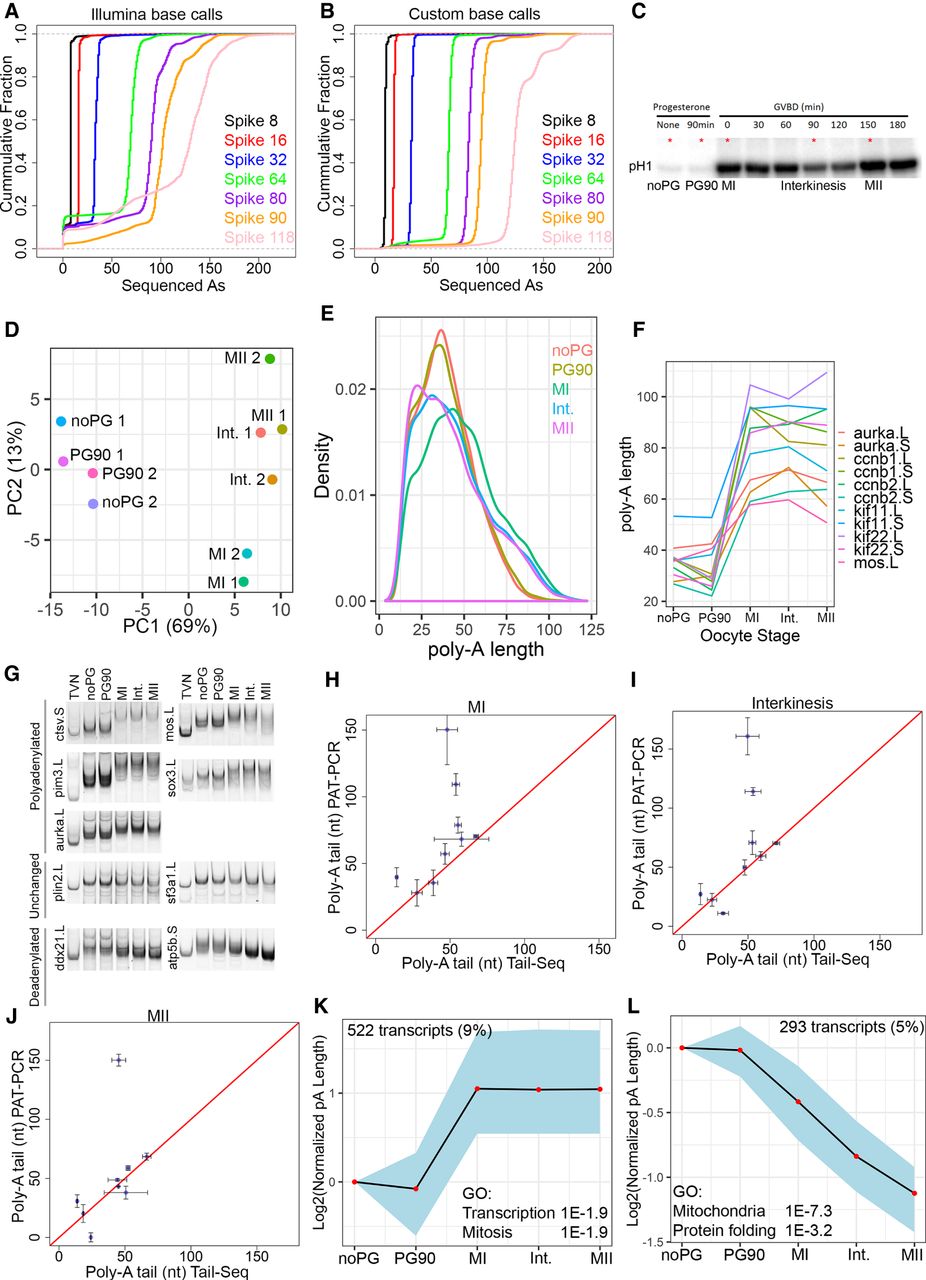
Measurement of poly(A) tail changes during oocyte maturation. (A) Synthetic spike sequences containing various lengths of A homopolymers were sequenced using an Illumina miSeq. Cumulative distribution plot shows the poly(A) lengths as determined by the Illumina base-calling software. (B) A custom algorithm was developed to more accurately determine the length of poly(A) sequences from raw Illumina sequencing files. Cumulative distribution plot shows the distribution of poly(A) lengths determined by our custom software on the same sequencing data presented in A. (C) Histone H1 kinase assays of oocytes as they progress through meiotic maturation. Red asterisk indicates time points that were used for Tail-seq and polysome analysis. (D) Tail-seq measurements from two biological replicates were analyzed using principal components analysis. PCA plot shows the relationship between different time points and different biological replicates. (E) Histogram showing measured poly(A) tail lengths at five time points spanning meiotic maturation. Curves are the average of two replicates. (F) Average measured poly(A) tail lengths for mRNAs previously reported to be polyadenylated during oocyte maturation. In X. laevis many genes have paralogs which are indicated by a .L and .S designation. (G) PAT assay was used to analyze poly(A) tail length of the indicated transcripts during oocyte maturation. Similar results were observed in an additional biological replicate (not shown). Poly(A) tail predictions from our Tail-seq data are indicated beside the gene name. (H–J) Scatterplots comparing poly(A) tail lengths measured by Tail-seq and the PAT assay at MI, Interkinesis, and MII. (K) STEM cluster of transcripts exhibiting increased polyadenylation during oocyte maturation. Enriched GO terms are indicated on the plot. (L) STEM cluster of deadenylated transcripts and enriched GO terms.




