


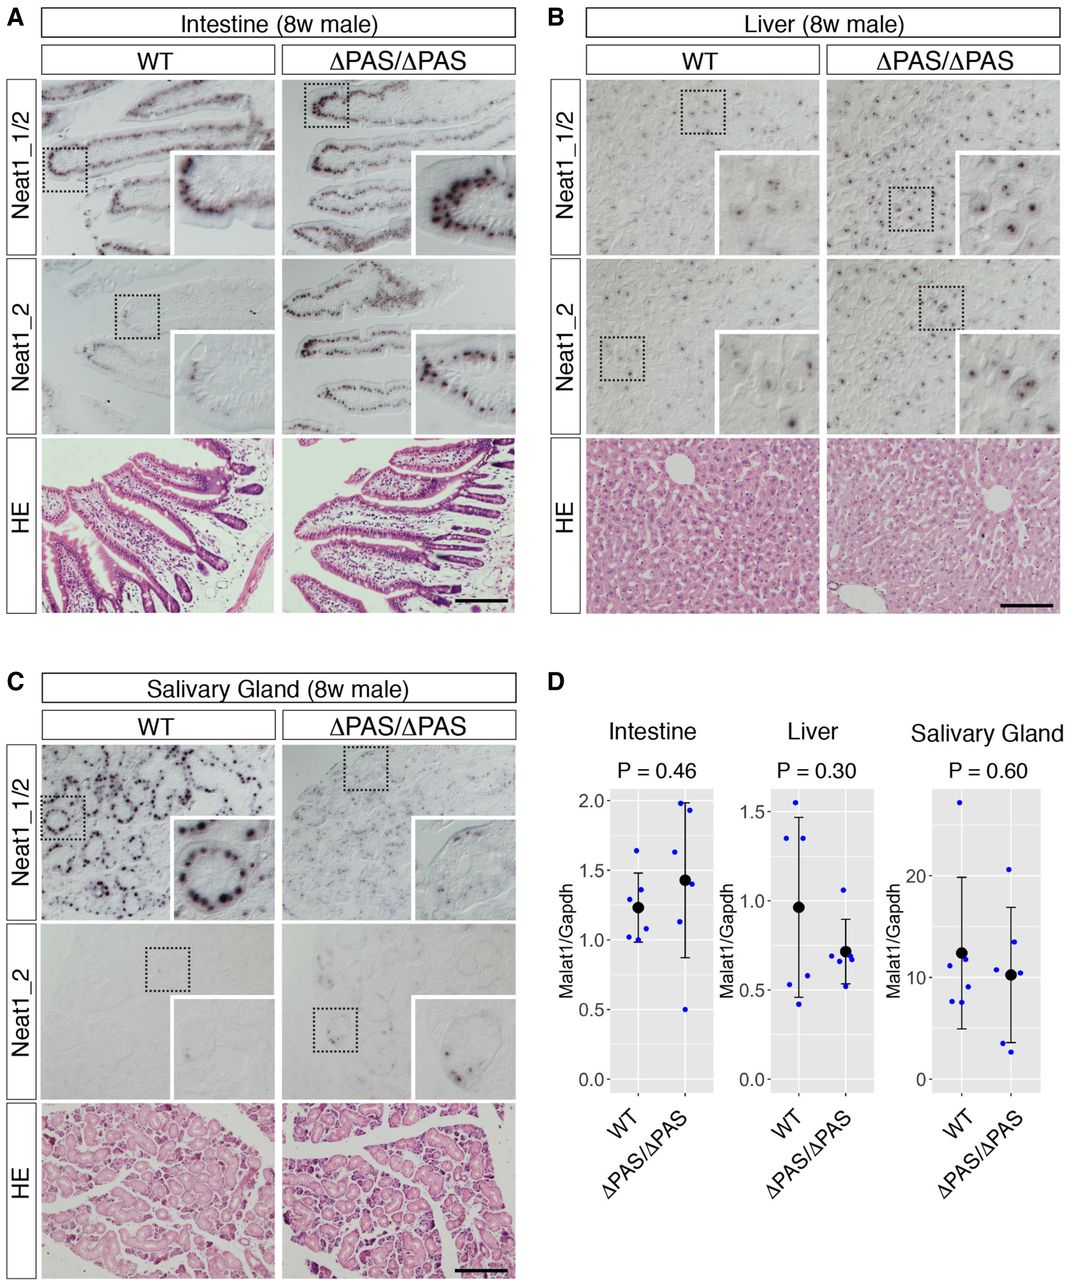
In situ hybridization analyses of Neat1 expression in Neat1ΔPAS/ΔPAS mice. (A–C) Expression of the Neat1 isoform revealed by probes that detected Neat1_1/2 and Neat1_2 in the intestine (A), liver (B), and salivary gland (C). Neat1_2 expression is normally restricted to the tip cells of the intestinal epithelium and expanded to the middle area of the epithelium in Neat1ΔPAS/ΔPAS (ΔPAS/ΔPAS) mice. Signals detected by the Neat1_1/2 probe were dramatically reduced in the salivary gland. None of these tissues exhibited histological abnormalities, as revealed by hematoxylin-eosin staining (HE). Dotted boxes indicate the area shown in the insets at higher magnification. Scale bars, 100 µm. (D) Quantification of Malat1 expression in the intestines, livers, and salivary glands of WT and Neat1ΔPAS/ΔPAS (ΔPAS/ΔPAS) mice (n = 6) using qPCR. The mean values from technical duplicates were used for the statistical analyses. The black dots and bars represent the mean value and the standard deviation for the biological duplicates, respectively. The blue dots represent values for each individual. P-values were calculated by Student's t-tests.




