


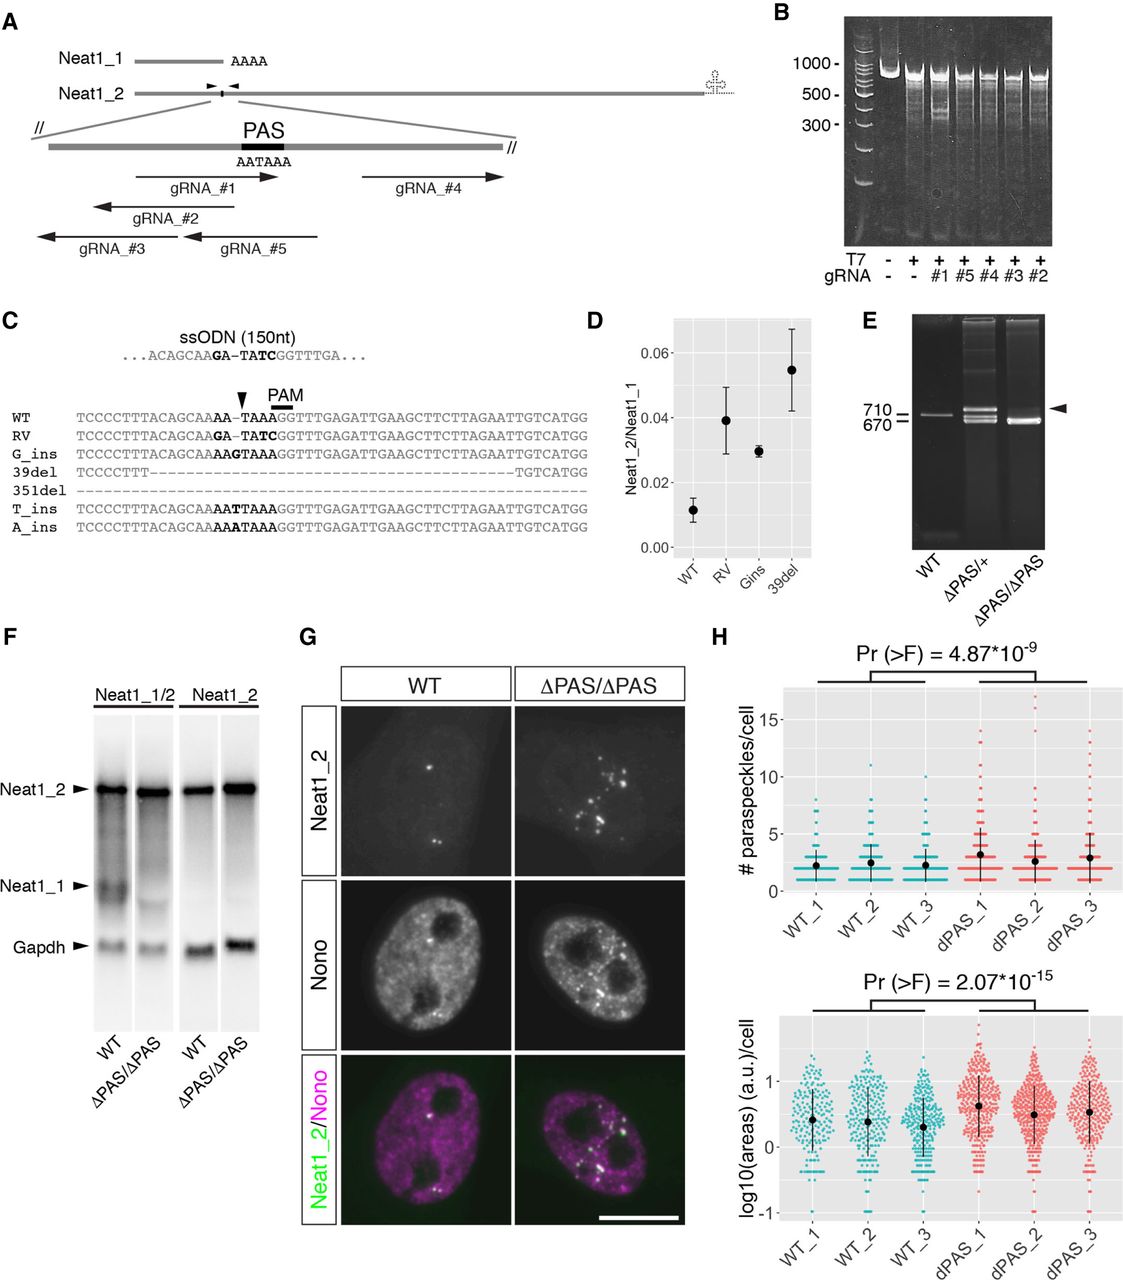
Generation of Neat1ΔPAS/ΔPAS mice. (A) Schematics of gRNAs targeting the region surrounding the polyadenylation [poly(A)] signal (PAS) AATAAA. Arrowheads indicate the positions of the primers used for the T7 endonuclease assay. (B) A T7 endonuclease assay evaluated the efficiency of gRNA-Cas9 endonuclease activity. Note that gRNA #1 exhibited the highest activity. (C) Sequence analysis of genome-edited mice. Six different mutant alleles were observed. The arrowhead indicates the position of the predicted cleavage site. Bold characters indicate the mutated nucleotides. (D) Comparison of the ratio of Neat1_1 and Neat1_2 expression with mutant alleles. Total RNA was obtained from the salivary glands of mutant mice (n = 2 for each line), and Neat1 expression was analyzed by RT-qPCR and calculated from technical duplicates. Note that 39del (ΔPAS) exhibited the highest Neat1_2/Neat1_1 ratio. P-values were calculated by Student's t-test. Blue dots and bars represent the mean value and the standard deviation for the biological duplicates, respectively. (E) An agarose electrophoresis gel image of PCR products that were amplified with genotyping primers. Note that a heteroduplex band that exhibited low mobility was obtained from a heterozygous mouse (arrowhead). (F) Northern blot analyses of total RNAs obtained from MEF cells derived from WT and Neat1ΔPAS/ΔPAS (ΔPAS/ΔPAS) mice. Neat1_1 was completely absent, whereas Neat1_2 was up-regulated in Neat1ΔPAS/ΔPAS mice. (G) Simultaneous detection of Neat1_2 and Nono in MEF cells prepared from WT and ΔPAS embryos. Scale bar, 10 µm. Note that the number of paraspeckles increased in KO MEFs. (H) Quantification of the area and the number of paraspeckles shown in F, as visualized by beeswarm plots. Three independent MEFs for each genotype were prepared from different embryos, and <300 cells for each batch of MEFs were used for the measurements. P-values [Pr (>F)] were calculated by two-way Anova tests. Black dots and bars represent the mean value and the standard deviation for the biological replicates, respectively.




