


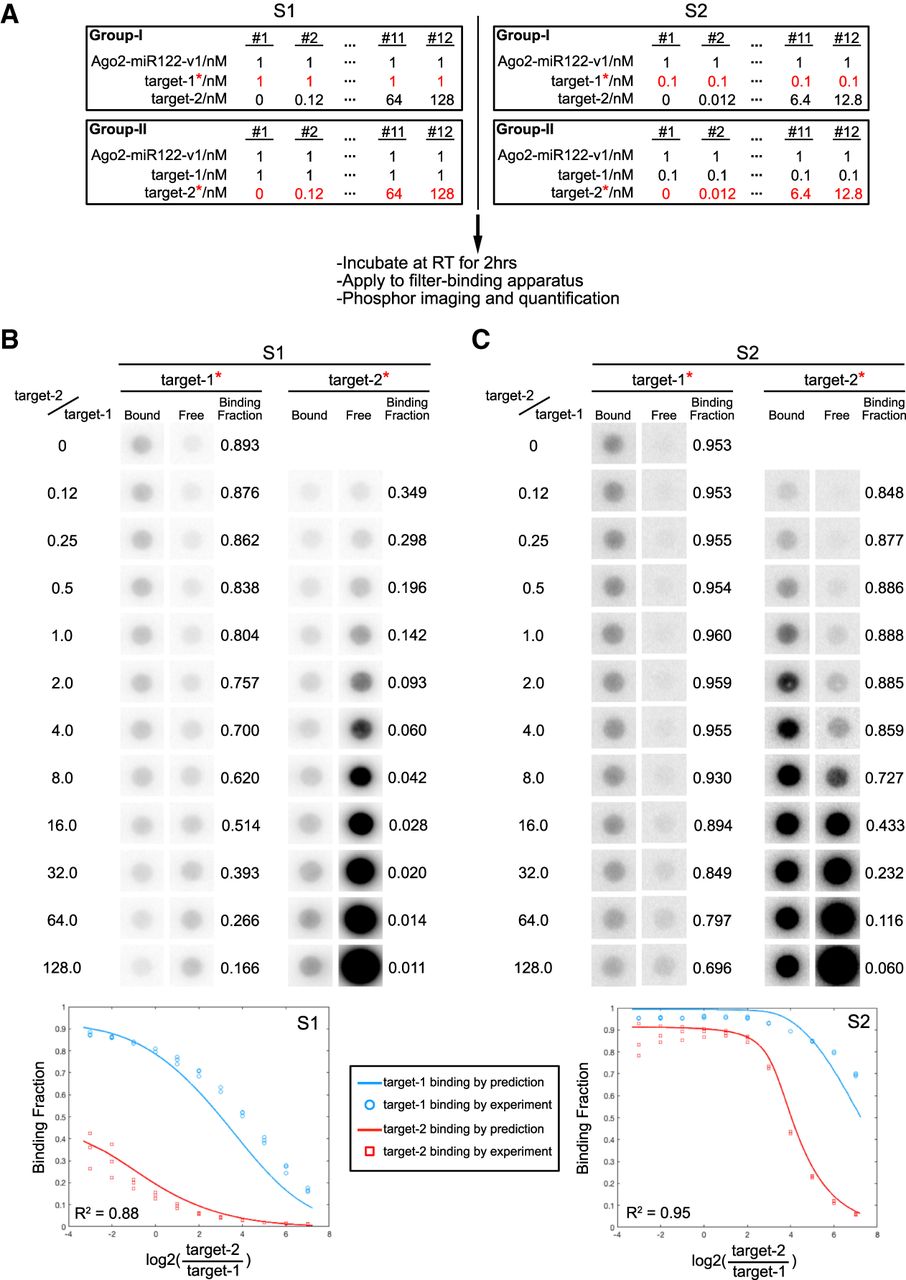
Biochemical validation of predicted target discrimination by Ago2–miR122-v1. (A) Experimental parameters and flowchart. Two situations (S1 and S2) were examined in which target-1 concentration was either 1 nM (S1) or 0.1 nM (S2). Ago2–miR122-v1 concentration was fixed at 1 nM. The concentration of target-2 was varied between 0–128 nM. For each situation two reactions were run in parallel with either target-1 or target-2 32P-labeled. (B) Bound and free target RNAs in S1. (Top) Phosphorimages of bound and free 32P-labeled target-1 or target-2 in S1. Note that binding fraction of target-1 (seed + sup target) is always higher than target-2 (seed-only). (Bottom) Theoretically predicted and experimentally measured data are plotted in the same graph for comparison. (C) Bound and free target RNAs in S2. (Top) Phosphorimages of bound and free 32P-labeled target-1 or target-2 in S2. Note that the binding fraction of target-1 (seed + sup target) is relatively uninfluenced by increasing concentrations of target-2 (seed-only). (Bottom) Theoretically predicted and experimentally measured data are plotted in the same graph for comparison. X-axis in graphs in B and C is plotted as log2(target − 2/target − 1) rather than target − 2/target − 1 in Figure 4E for even distribution of experimental data across the graph.




