


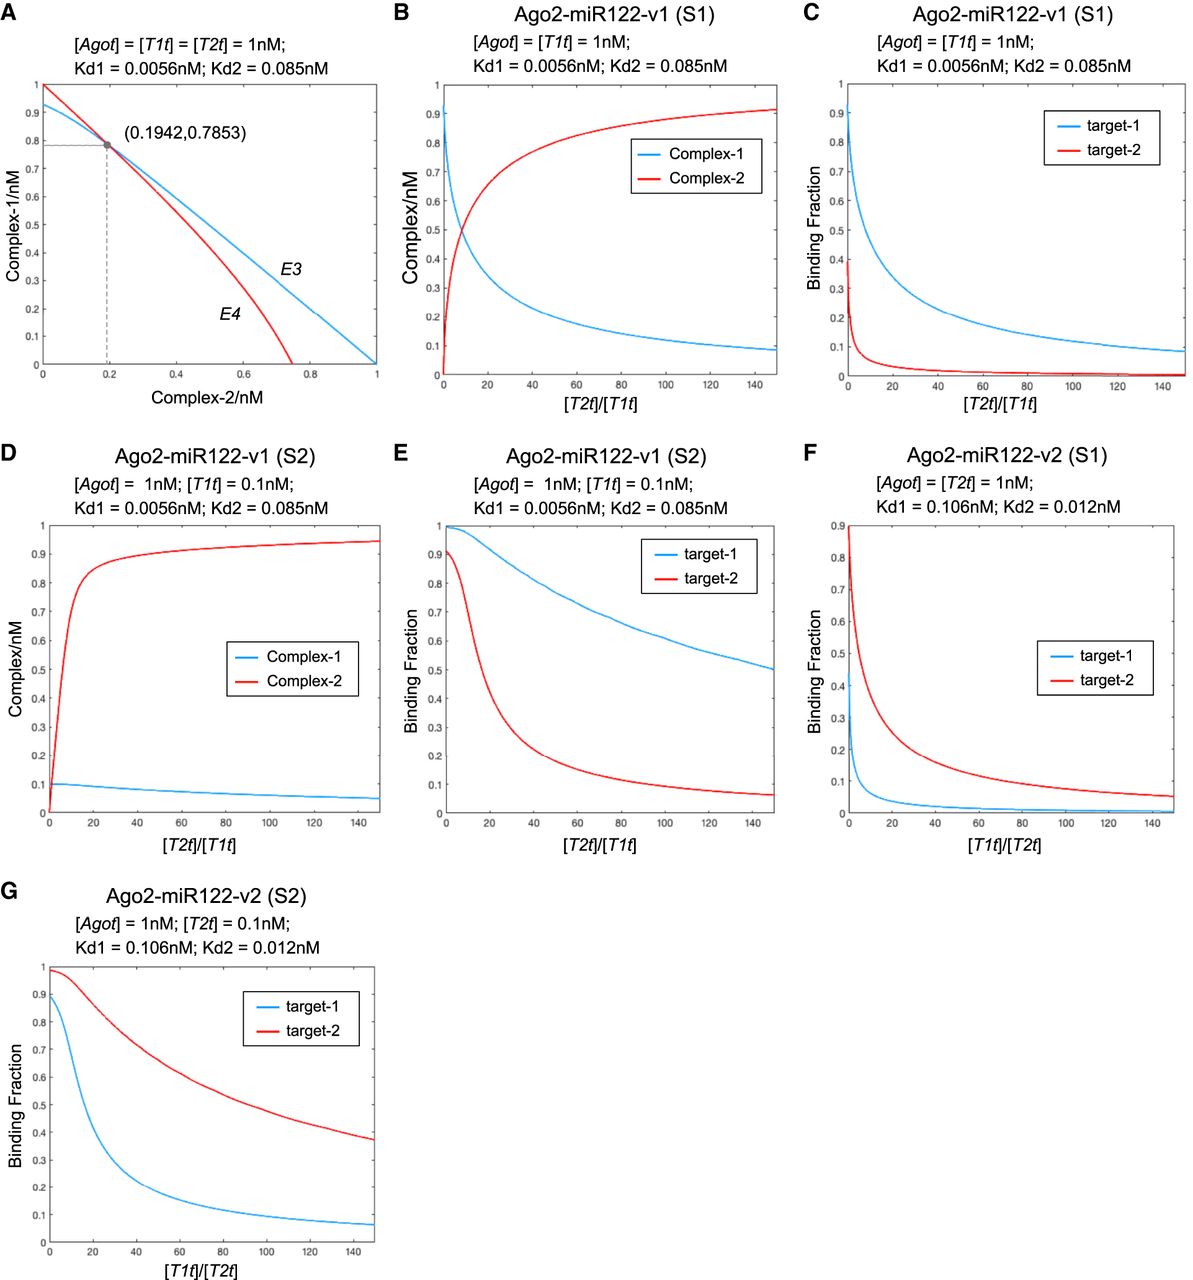
Prediction of Ago2–miRNA complex distribution between various amounts of two competing targets. (A) Plot of E3 and E4 as [C1e] versus [C2e] when [Agot] = [T1t] = [T2t] = 1 nM, Kd1 = 0.0056 nM (binding affinity between Ago2–miR122-v1 and target-1), and Kd2 = 0.085 nM (binding affinity between Ago2–miR122-v1 and target-2). The intersection coordinate is (0.1942,0.7853), meaning that the calculated concentrations of Complex-1 and Complex-2 at equilibrium are 0.7853 and 0.1942 nM, respectively. (B) Predicted concentrations of Complex-1 (blue line) and Complex-2 (red line) plotted as a function of the target-2:target-1 ratio. In this simulation (S1) Ago2–miR122-v1 and target-1 were fixed at 1 nM, and target-2 was varied. (C) Fraction of total target-1 (blue) and target-2 (red) bound to Ago2–miR122-v1 plotted as a function of the target-2:target-1 ratio. In this simulation (S1) Ago2–miR122-v1 and target-1 concentrations were fixed at 1 nM, and target-2 concentration was varied. (D) Predicted concentrations of Complex-1 (blue line) and Complex-2 (red line) plotted as a function of the target-2:target-1 ratio. In this simulation (S2) Ago2–miR122-v1 and target-1 concentrations were fixed at 1 and 0.1 nM, respectively, and target-2 concentration was varied. (E) Fraction of total target-1 (blue) and target-2 (red) bound to Ago2–miR122-v1 plotted as a function of the target-2:target-1 ratio. In this simulation (S2) Ago2–miR122-v1 and target-1 concentrations were fixed at 1 and 0.1 nM, respectively, and target-2 concentration was varied. (F) Fraction of total target-1 (blue) and target-2 (red) bound to Ago2–miR122-v2 plotted as a function of the target-1:target-2 ratio. In this simulation (S1) Ago2–miR122-v2 and target-2 concentrations were fixed at 1nM, and target-1 concentration was varied. (G) Fraction of total target-1 (blue) and target-2 (red) bound to Ago2–miR122-v2 plotted as a function of the target-1:target-2 ratio. In this simulation (S2) Ago2–miR122-v2 and target-2 concentrations were fixed at 1 and 0.1 nM, respectively, and target-1 concentration was varied.




