


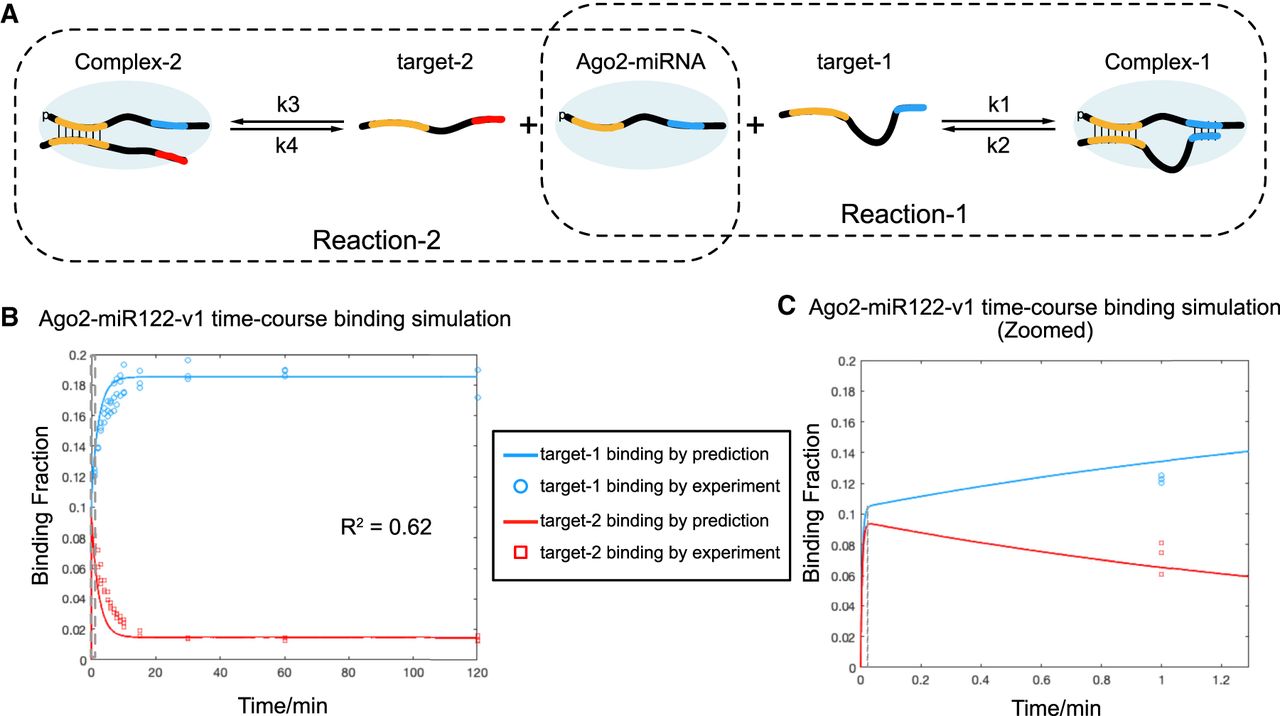
FIGURE 3.
Mathematical model for Ago2–miRNA time-course distribution of two competing targets. (A) Illustration of Ago2–miRNA binding two competing target RNAs. (B) Predicted fractions of target-1 (blue) and target-2 (red) bound by Ago2–miR122-v1 plotted as a function of time (solid lines). Experimental data from Figure 2 are included for comparison (open circles and squares). Dashed line indicates region shown in panel C. (C) Close up view of earliest time point in panel B. Solid lines indicate predicted fractions of target RNAs bound by Ago2–miR122-v1.




