


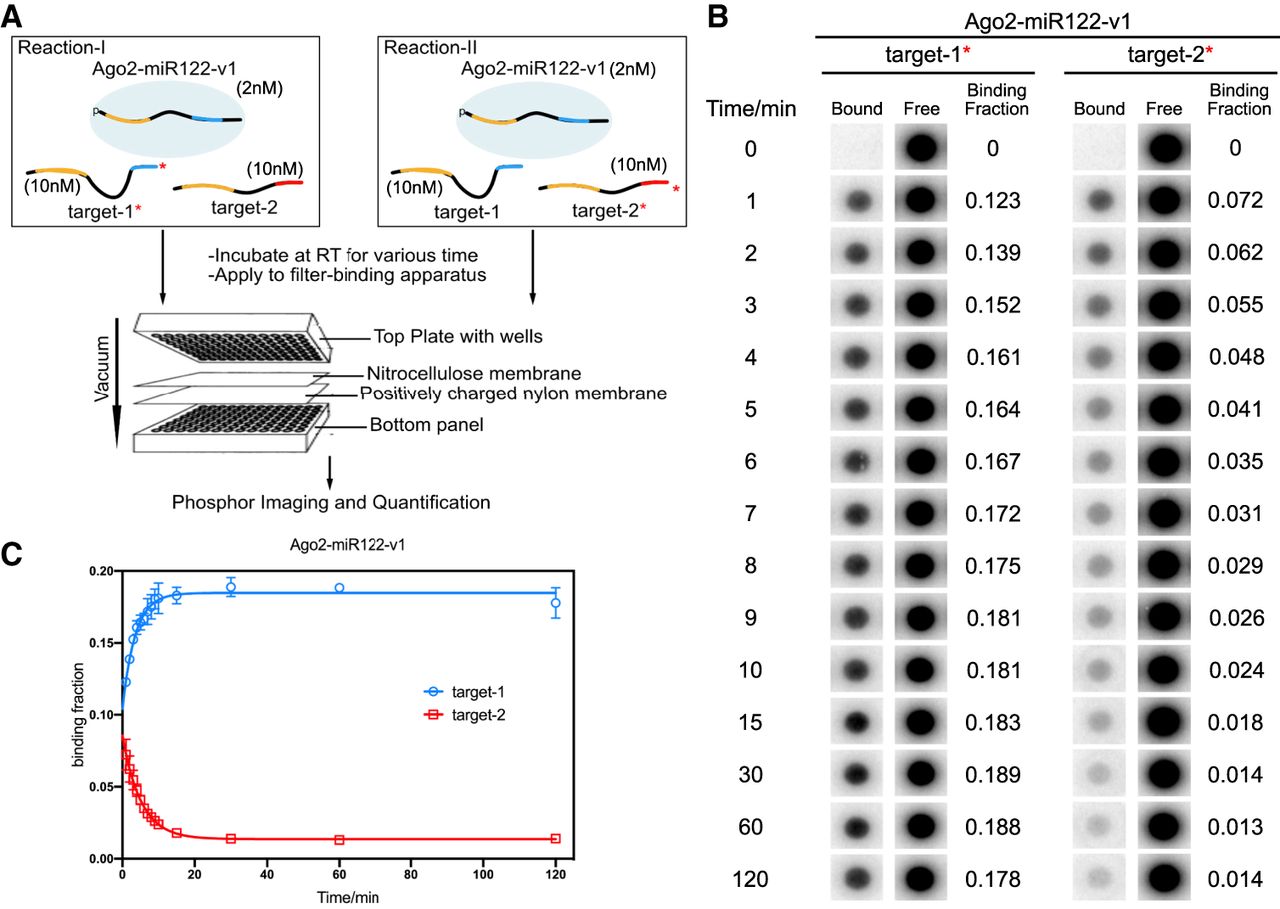
FIGURE 2.
Distribution of Ago2–miRNA-v1 between competing targets over time. (A) Flowchart schematic of the experimental setup. For each experiment two reactions were run in parallel (with either target-1 or target-2 32P-labeled). (B) Phosphorimages of 32P-labeled target RNAs in bound (to Ago2–miR122-v1) or free fractions. Binding fractions are the means of three independent replicates. (C) Quantified binding data in panel B plotted as a function of incubation time. Data were fit into one-phase decay (Plateau of target-1 = 0.18; Plateau of target-2 = 0.014). All plotted data are the means of at least three independent replicates. Error bars indicate SD.




