


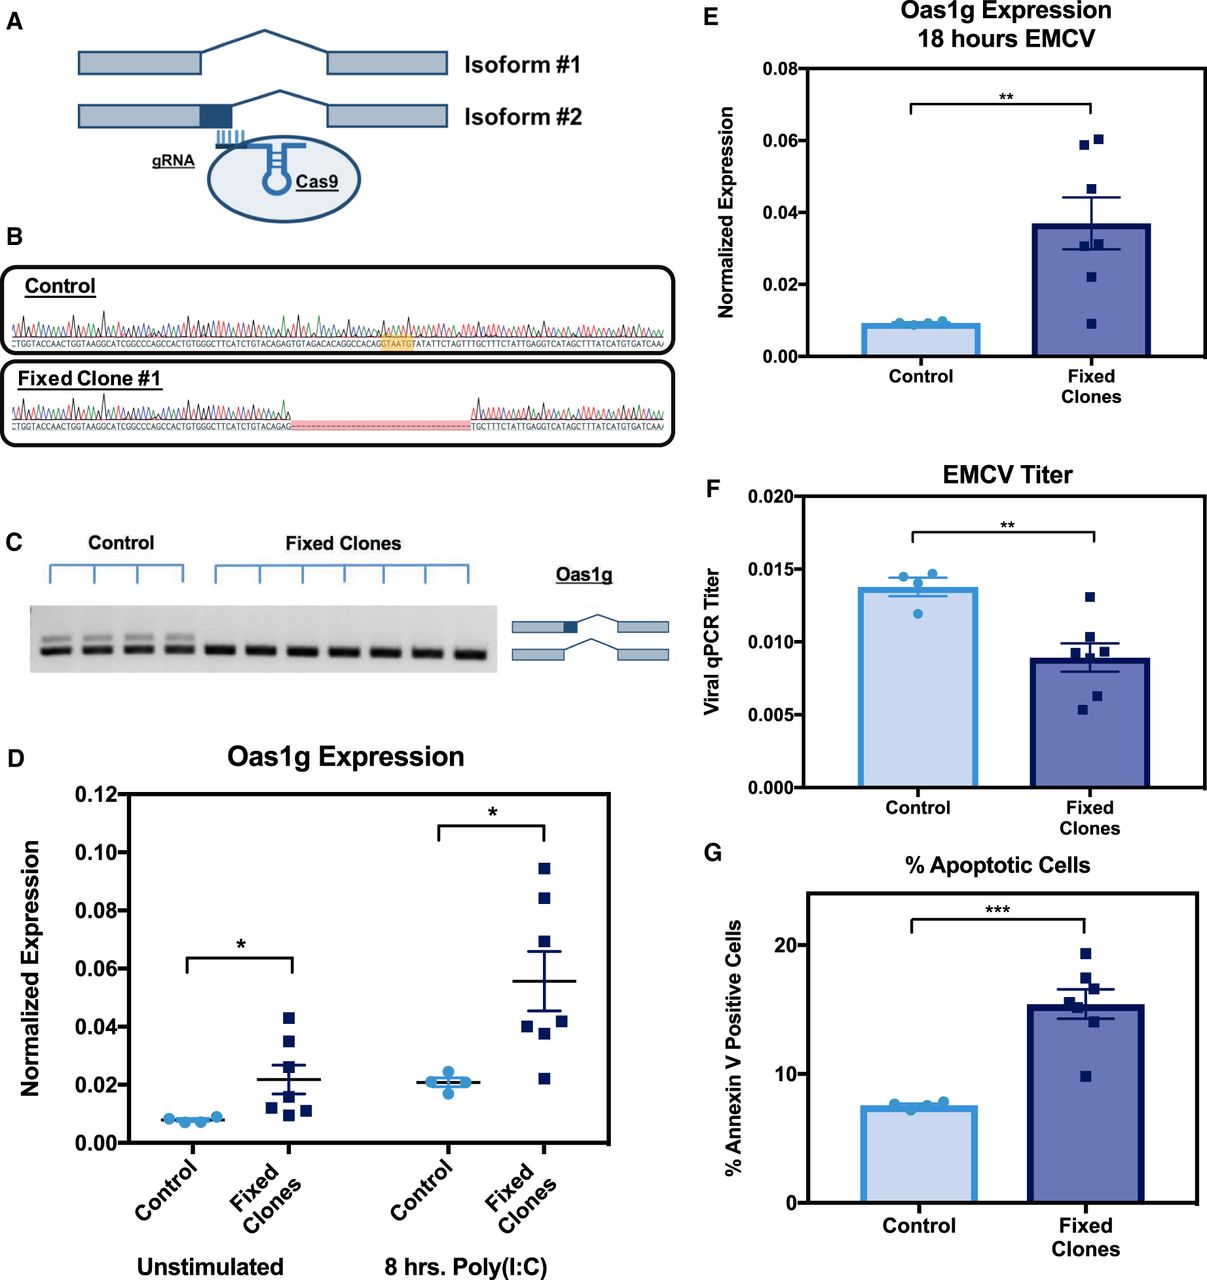
Removal of alternative splice site alters Oas1g expression and macrophage response to EMCV. (A) Schematic representation of the two alternative splice isoforms, and the gRNA/Cas9 targeting of the alternative splice site. (B) Sanger sequencing gDNA from a control sample (top) and an Oas1 SS KO sample (bottom). Sequencing is oriented such that the negative strand runs left to right. The alternative splice site is represented by the yellow highlighted region. (C) RT-PCR upon stimulation with poly(I:C) confirming alternative splice site usage in control populations and forced productive splicing in fixed clones. (D) RT-qPCR analysis of Oas1g mRNA levels in unstimulated and stimulated [8 h poly(I:C)] macrophages. Control samples are represented in light blue, SS KO clones are represented in dark blue. (E) RT-qPCR analysis of Oas1g mRNA levels in EMCV infected (18 h) macrophages. Control samples are represented in light blue, SS KO clones are represented in dark blue. (F) RT-qPCR measurement of EMCV viral load following 18 h of infection at 1 MOI. Control samples are represented in light blue, SS KO clones are represented in dark blue. (G) Annexin V staining for apoptotic cells under unstimulated conditions. Control samples are represented in light blue, SS KO clones are represented in dark blue. Data is representative of two independent experiments (D–G) and is shown as mean (error bars indicate SEM). (*) P < 0.05, (**) P < 0.01, and (***) P < 0.001 using a Student's t-test. Results are presented relative to those of Rpl32 (D–F).




