


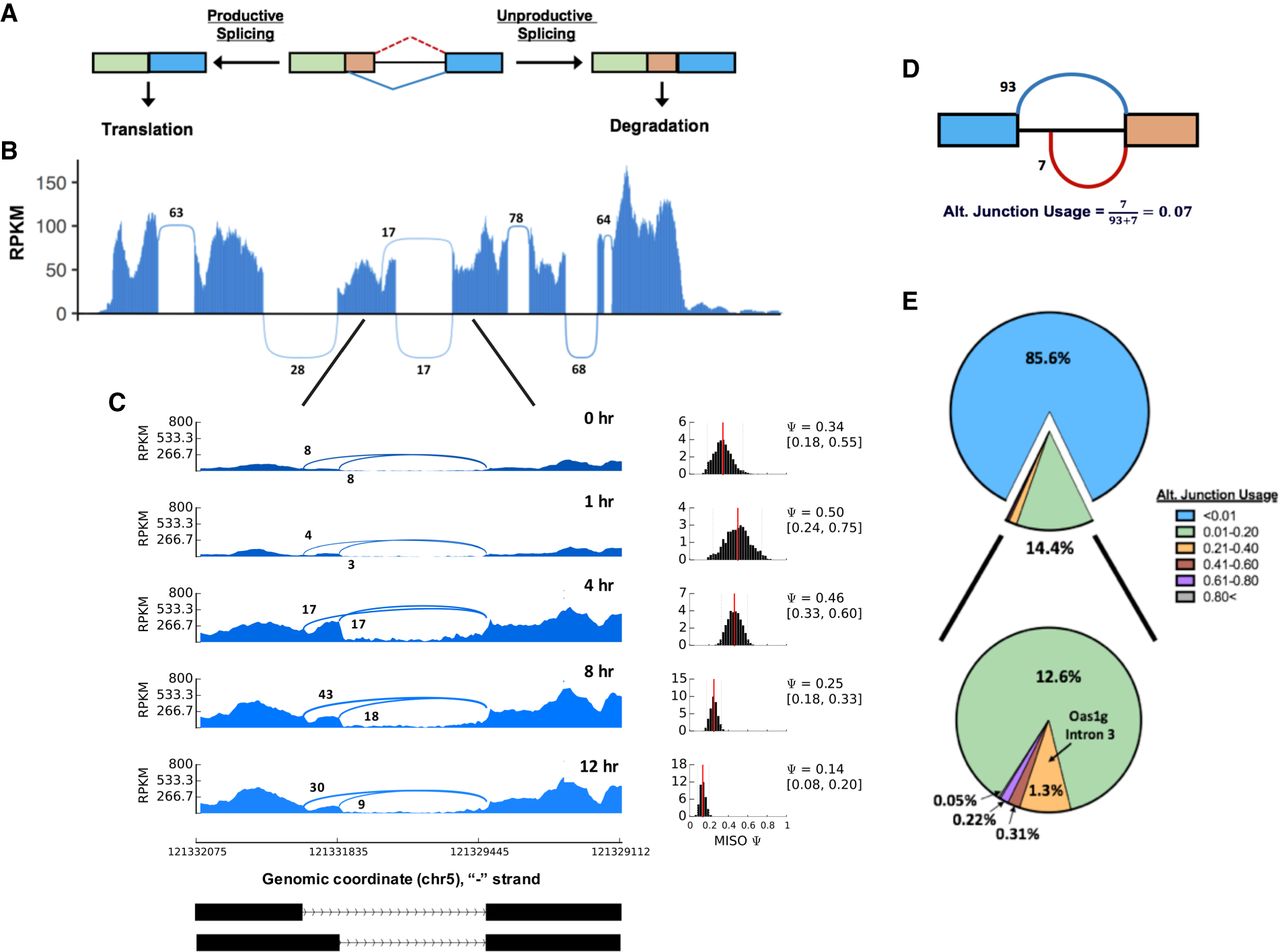
Oas1g has a frequent AS-NMD event. (A) A schematic depiction of an AS event leading to either a productive isoform destined for translation or an unproductive isoform destined for degradation. (B) Sashimi plot for the entire gene body of Oas1g from BMDMs stimulated with poly(I:C) for 12 h. Sequenced RNA is derived from the total nuclear fraction. Oas1g is a negative strand gene and is oriented such that the negative strand runs left to right. (C) (Left) Sashimi plots centered at the third junction of Oas1g from BMDMs stimulated with poly(I:C) for 0, 1, 4, 8, and 12 h. Sequenced RNA is derived from the total nuclear fraction. The y-axis represents reads per kilobase of transcript, per million mapped reads (RPKM). (Right) Posterior distributions of the Ψ value for each individual time point. The mean Ψ is depicted by the red line. Mean and 95% confidence intervals are labeled to the right of the posterior distribution. (D) Schematic representation of the alternative junction usage calculation. (E) Pie chart representing alternative junction usage for all expressed junctions upon 8 h. of poly(I:C) stimulation. The slice including the alternatively spliced third junction of Oas1g is labeled (alt. junction usage 0.21–0.40). Genomic coordinates represent the mm9 genome assembly.




