


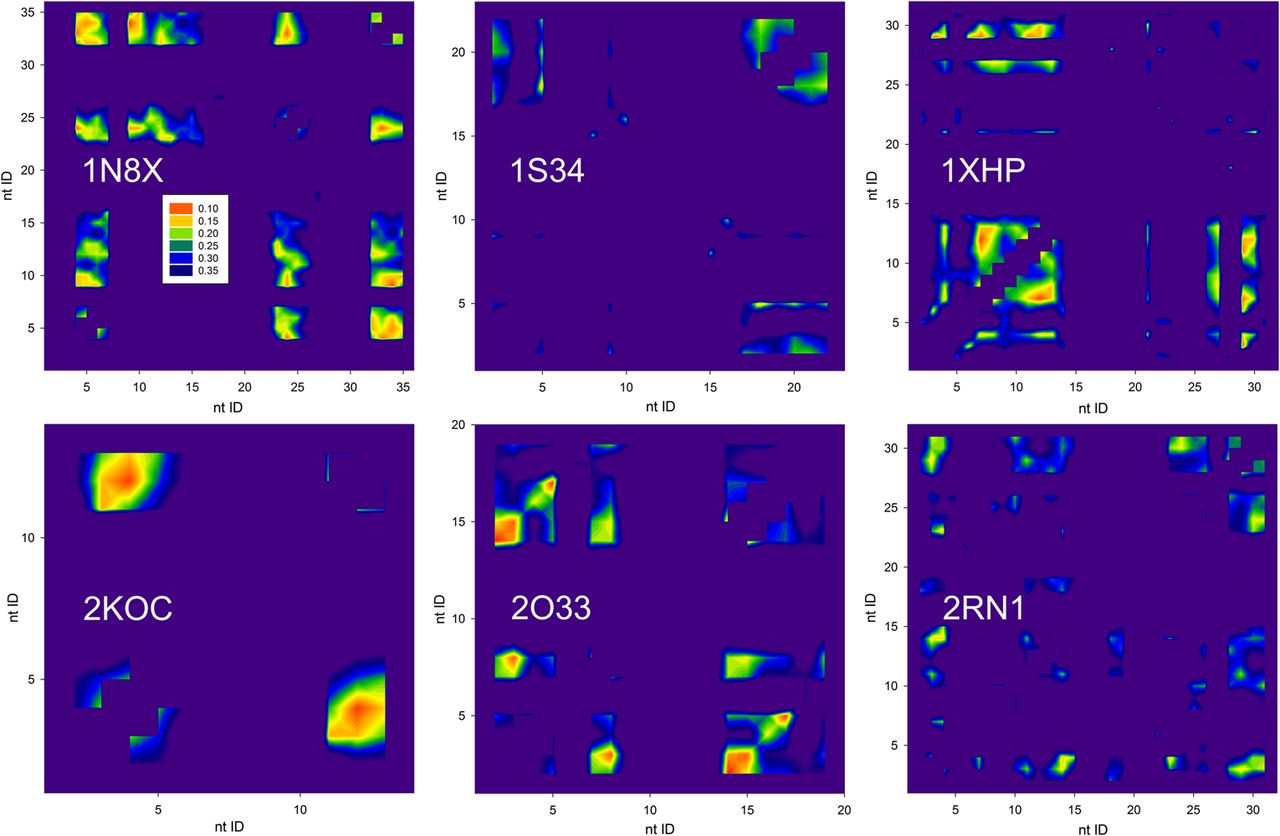
FIGURE 1.
Internucleotide CSS maps for the six tested RNA constructs. Progression of colors from red to blue corresponds to the CSS values increasing from 0.07 p.p.m. to 0.40 p.p.m. Nucleotide ID numbers match those in the corresponding PDB depositions.




