


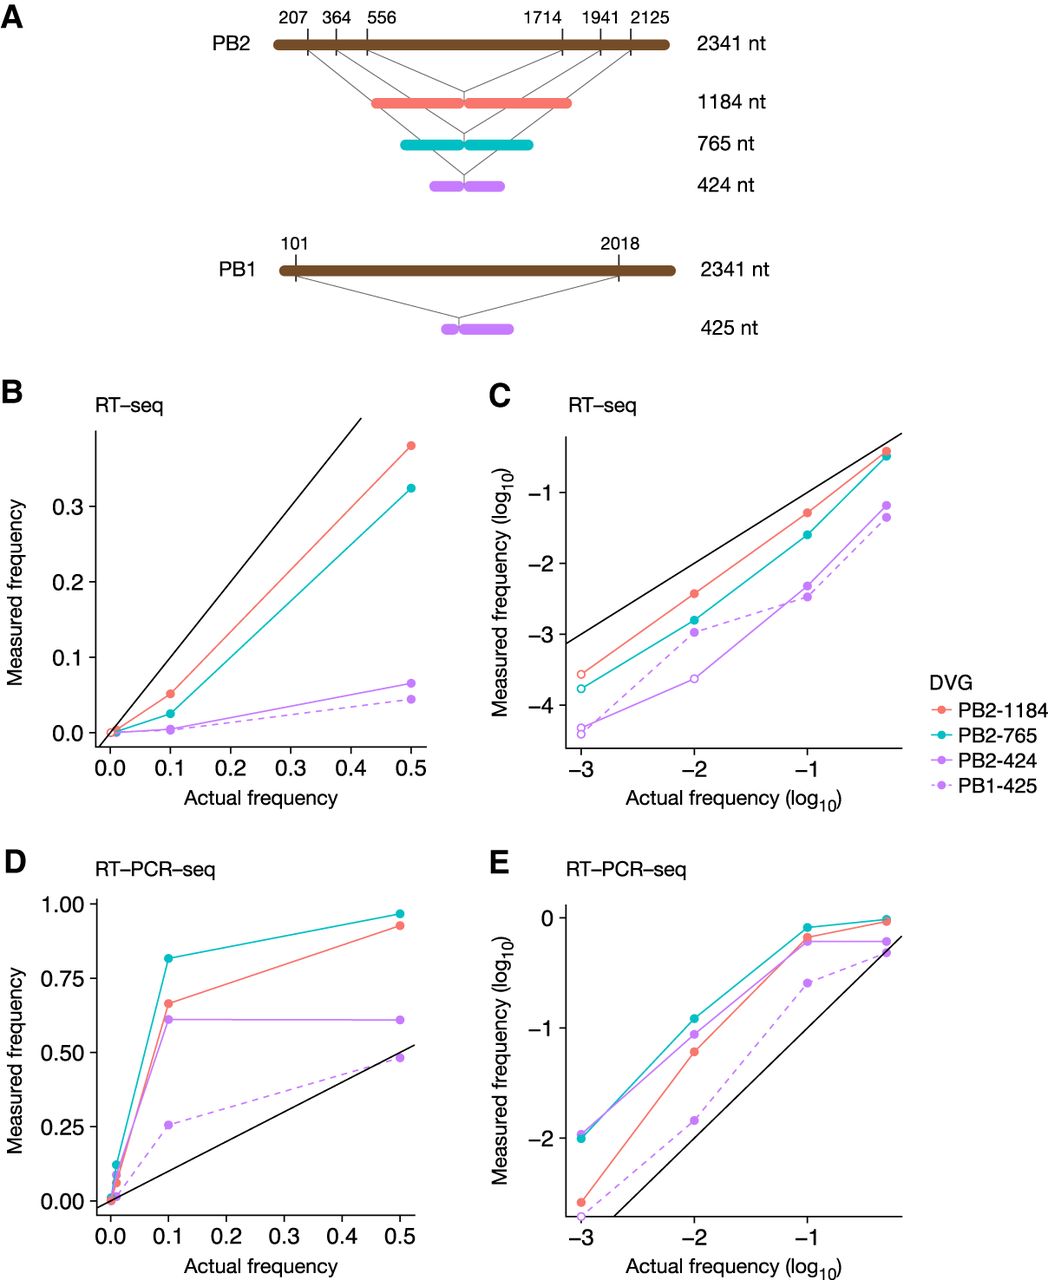
Comparison of RT-seq and RT-PCR-seq using synthetic pseudo-DVG RNAs. (A) Schematic representation of the synthetic RNAs corresponding to PB2- and PB1-derived pseudo-DVGs. (B–E) The synthetic RNAs shown in A were added to an equimolar mix of eight synthetic full-length pseudo-vRNAs, using different molar ratios between the pseudo-DVG and the corresponding full-length vRNA. The final mixes were processed for RT-seq (B,C) or RT-PCR-seq (D,E) and analyzed with the DG-seq pipeline. The measured frequency of each synthetic pseudo-DVG is plotted as a function of the actual frequency with a linear (B,D) or a logarithmic (C,E) scale. Open circles represent read counts below the background noise threshold (i.e., <14).




