


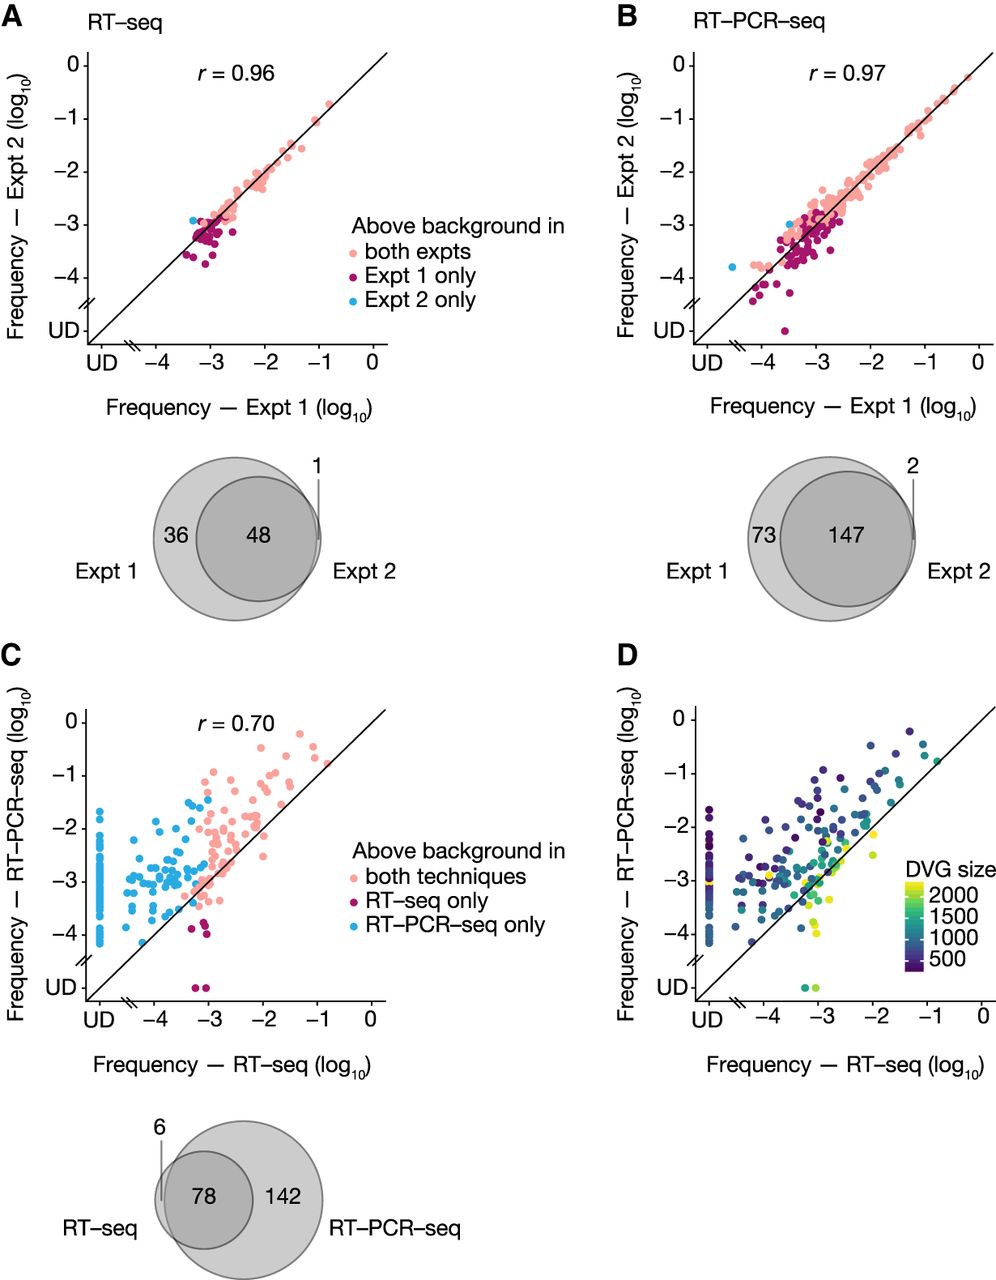
Reproducibility of DVG analysis using the DG-seq pipeline. (A,B) Expt 1 and 2 correspond to two independent purifications of genomic vRNAs from the same three viral stocks (WT and mutant A/WSN/33 viruses), followed by independent processing for RT-seq (A) or RT-PCR-seq (B) and analysis through the DG-seq pipeline. Each dot represents a distinct DVG identified with a read count above the background noise threshold, that is, ≥14 in both (pink dots) or in at least one of the experiments (red and blue dots). The frequency measured in Expt 2 is plotted as a function of the frequency measured in Expt 1, with a logarithmic scale (UD, undetected, i.e., read count = 0). Venn diagrams represent the numbers of DVGs identified above background in both or in one of the experiments. (C) For the subset of DVGs identified in Expt 1, the frequency measured upon RT-PCR-seq is plotted as a function of the frequency measured upon RT-seq, with a logarithmic scale (UD, undetected, i.e., read count = 0). Each dot represents a distinct DVG identified with a read count above the background noise threshold, that is, ≥14 with both (pink dots) or with at least one of the methods (red and blue dots). The Venn diagrams represent the numbers of DVGs identified above background with both or with one of the methods. r values indicated in A–C are Pearson correlation coefficients. (D) Same graph as in C, but with DVGs colored according to DVG size.




