


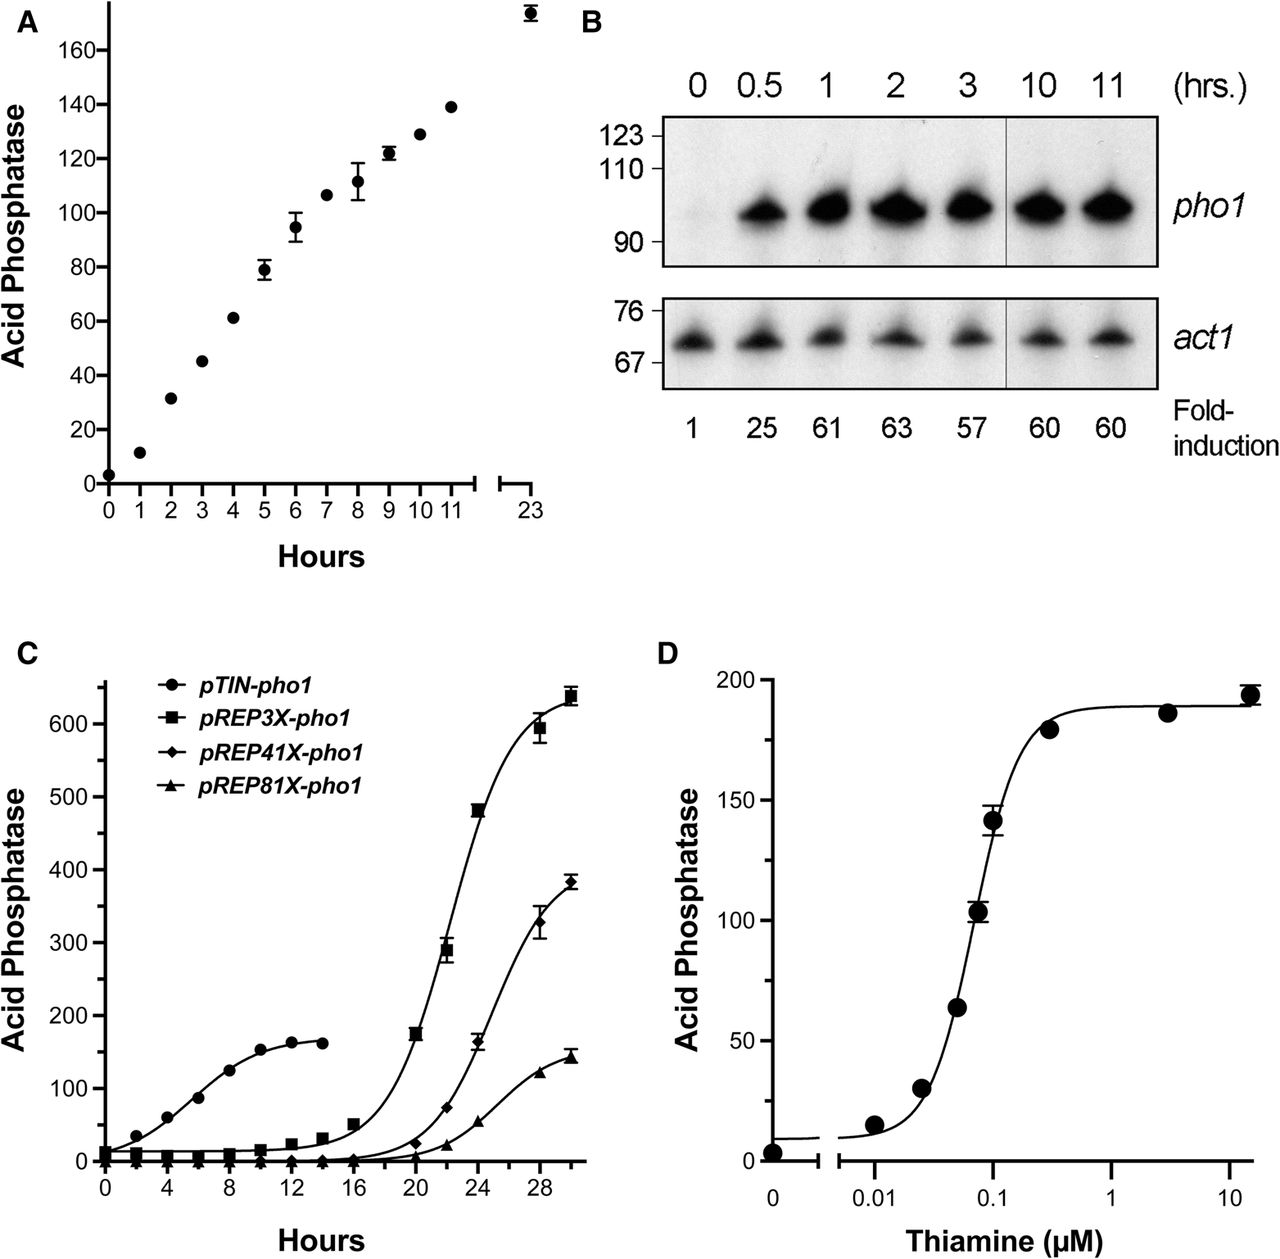
Kinetics of induction and titration of expression. (A) Single colonies of pho4Δ pho1Δ cells transformed with the pTIN-pho1 plasmid were pooled (≥20) and grown at 30°C in Leu− PMG without thiamine. Acid phosphatase activity was measured from an aliquot of the culture (time-0) and the remaining culture was adjusted to 15 µM thiamine. Acid phosphatase activity was measured at the indicated times after the addition of thiamine. Each data point is the average ± SEM from three independent cultures. (B) A representative culture of pho4Δ pho1Δ cells bearing the pTIN-pho1 plasmid was grown as described in Figure 3A, and aliquots were harvested before (time-0) or at the indicated times after the addition of thiamine. Total RNA prepared from harvested samples was analyzed by reverse transcription primer extension using a mixture of radiolabeled primers complementary to the pho1 (top panel) or the act1 (bottom panel) mRNAs. The reaction products were resolved by denaturing urea-PAGE and visualized by autoradiography. The images shown in the top and bottom panels are from a single exposure of one gel. For conciseness of the figure, the intervening lanes of the gel were cropped (represented by the thin line separating the 3- and 10-h samples). The positions and sizes (in nucleotides) of DNA markers are indicated on the left. Fold-induction reflects the ratio of the act1-normalized pho1 signal at the indicated time to time-0. (C) Single colonies of pho4Δ pho1Δ cells transformed with the indicated plasmids were pooled (≥20), where the pTIN-pho1 or the pREP(3×; 41×; 81×)-pho1 bearing cells were grown in Leu– PMG medium lacking thiamine or containing 15 µM thiamine, respectively. Pho1 expression was induced by adjusting thiamine concentration to 15 µM for the pTIN-pho1 bearing cells or by pelleting cells, washing twice with water and resuspending in Leu− PMG medium lacking thiamine for the pREP-series-pho1 bearing cells. Acid phosphatase activity was measured in repressed conditions (time-0) and at the indicated times after induction. Each data point is the average ± SEM from three independent cultures. The data were fit to a sigmoidal model (Boltzmann) in Graphpad Prism with a goodness of fit correlation coefficient of 0.99 for each induction curve. (D) pho4Δ pho1Δ cells bearing the pTIN-pho1 plasmid were propagated at 30°C in Leu− PMG medium lacking thiamine. The cells were then diluted and grown for 20–23 h in Leu− PMG medium with the indicated thiamine concentration. The acid phosphatase activity is the average ± SEM from three independent cultures. The data were fit to a dose-response model (EC50 shift) in Graphpad Prism with a goodness of fit correlation coefficient of 0.99, Hill slope of 2.29, and dose of half maximal response (EC50) of 0.069 ± 0.005 µM thiamine.




