


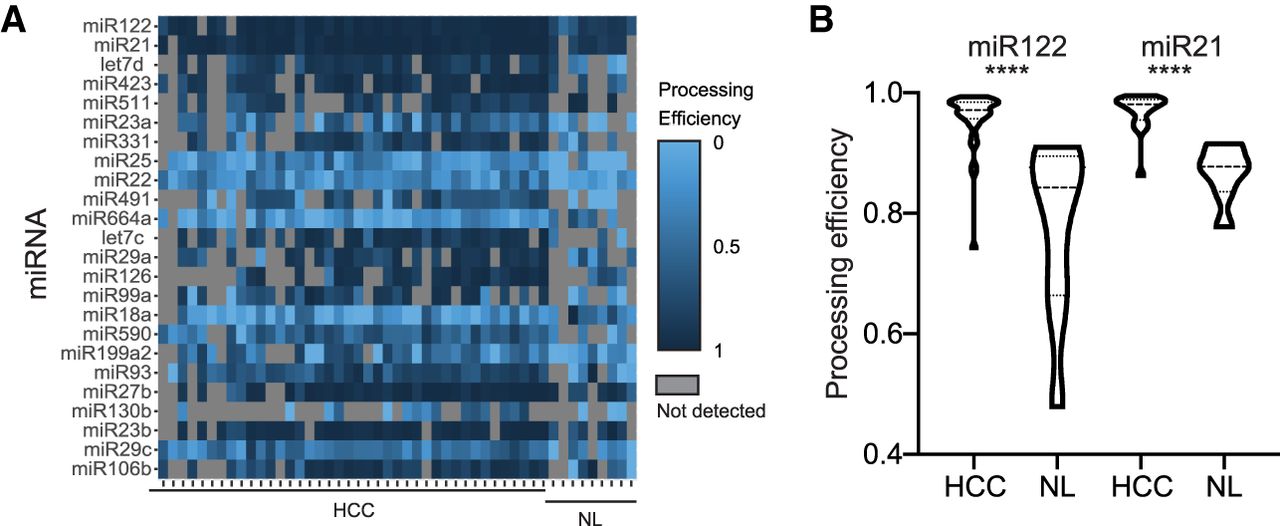
FIGURE 4.
Differential pri-miRNA processing between NL and HCC. (A) Heat-map of pri-miRNA levels of the 24 differentially processed pri-miRNAs between HCC and NL. miRNAs are shown with the most statistically significant changes between NL and HC at the top (miR122) and increasing P-values toward the bottom (miR106b). (B) Increased processing efficiency of pri-miRNAs in HCC compared to NL for miR-122 and miR-21. Shown is the processing efficiency as determined by RNA sequencing in all 40 HCC or all nine NL samples. (****) P < 0.0001, Wilcoxon rank test.




