


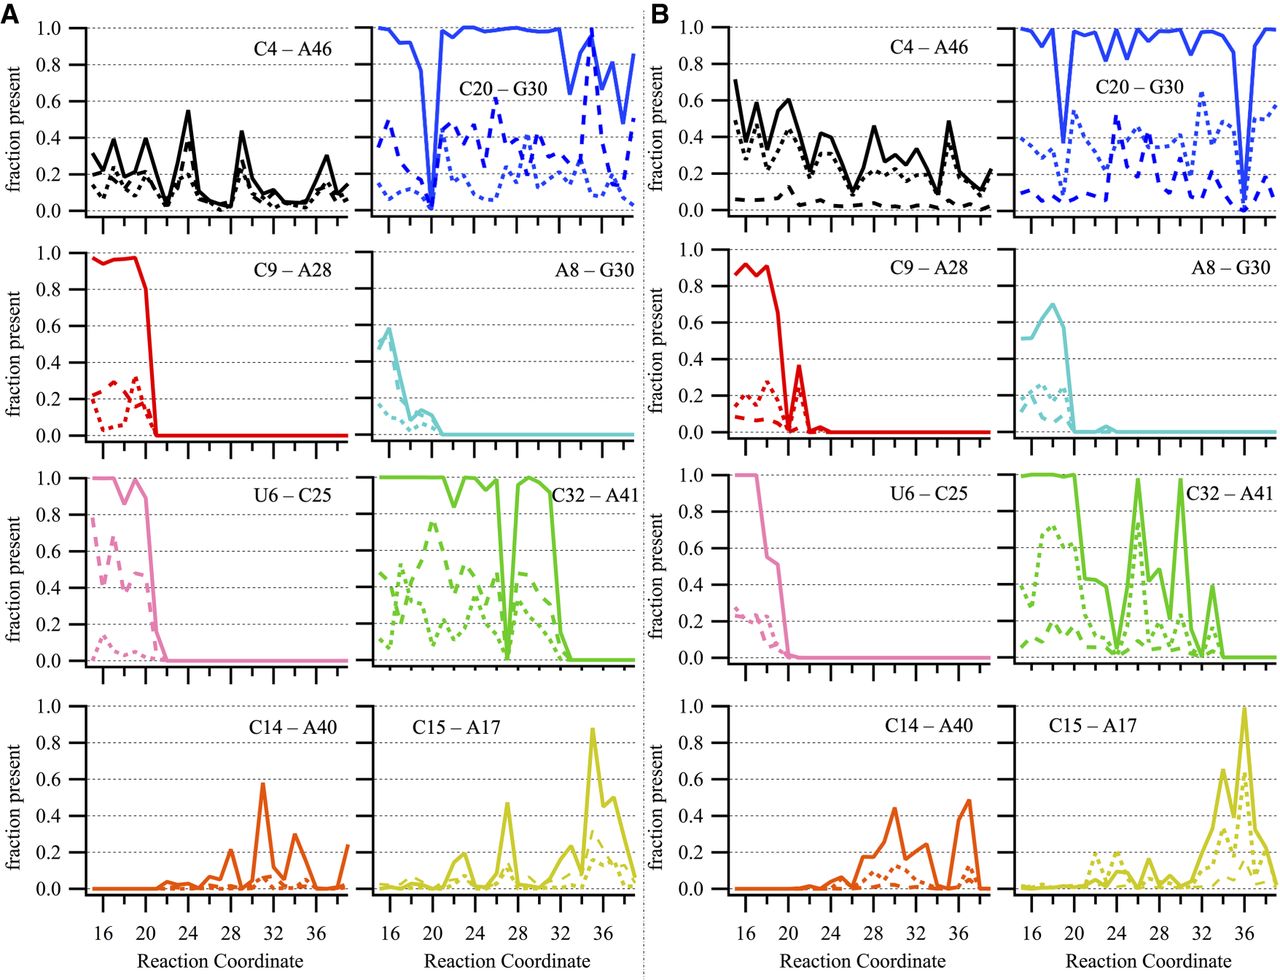
FIGURE 5.
Adjacent NBPO pairs in contact with Mg2+ and K+ ions at (A) 20 mM and (B) 100 mM MgCl2. Shown is the probability of selected NBPO pairs within 9 Å (solid line) and the probability of Mg2+ (dotted line) or K+ ions (dashed line) within 6.5 Å of NBPOs of both phosphates. The color of the lines in the individual panels corresponds to the NPBO pairs shown in Supplemental Figure S3c with the exception of C14—A40 and C15—A17 that are not shown in Supplemental Figure S3c.




