


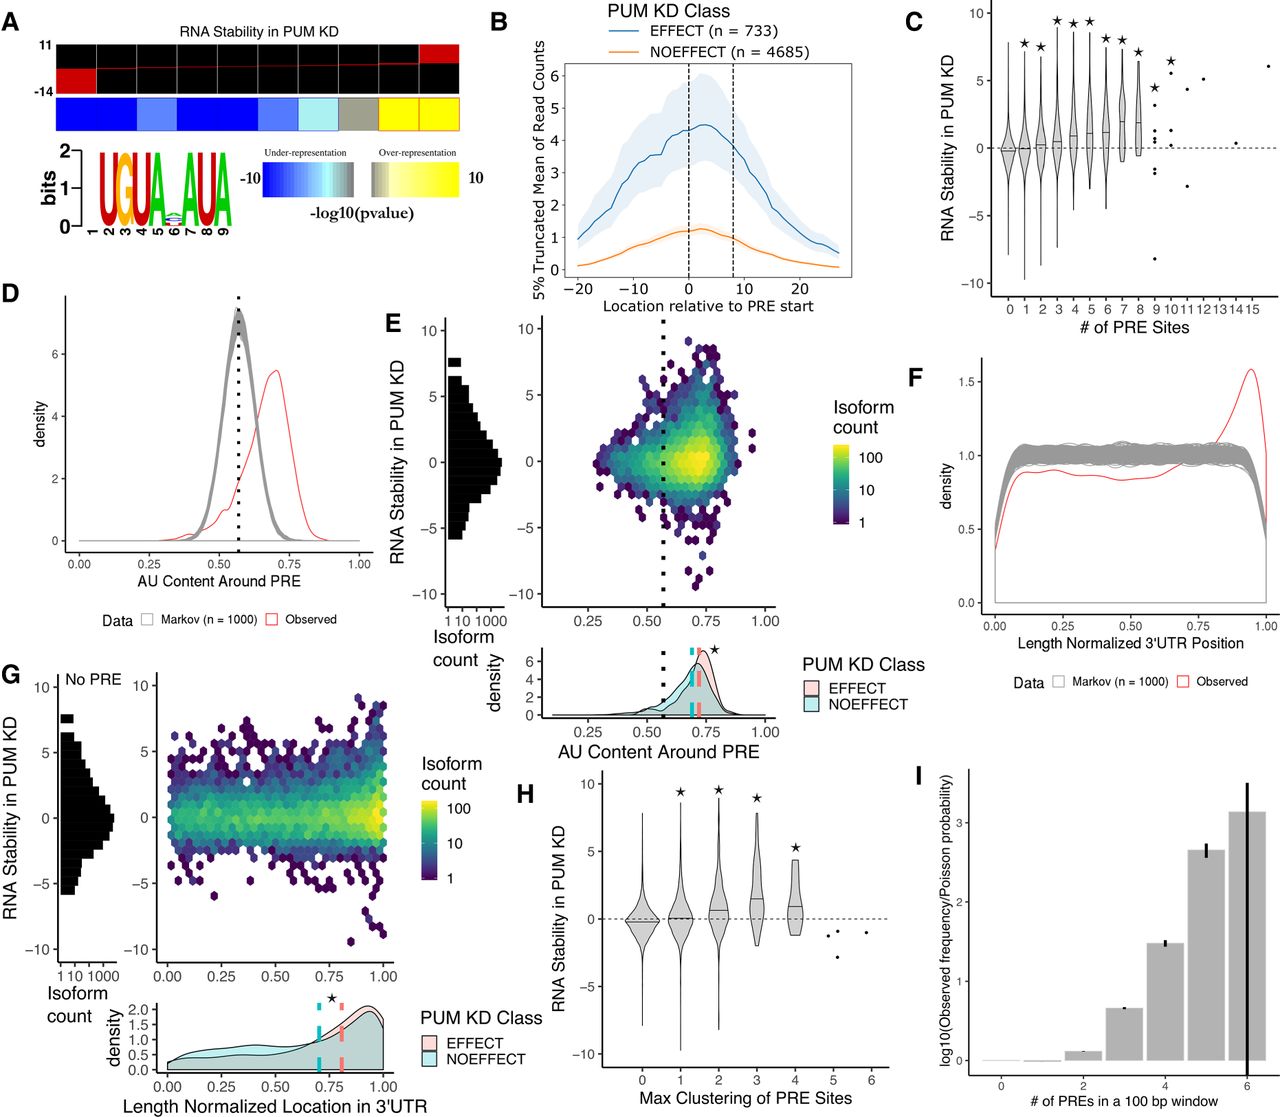
Features associated with a PUM recognition element (PRE) explain variability in PUM-mediated effect on decay. (A) Results of motif inference using FIRE (Elemento et al. 2007) on the stability in PUM knockdown data discretized into 10 equally populated bins. Red bars within each bin represent the spread of RNA stability values within each bin. Stability in PUM knockdown is represented by a normalized interaction term between time and condition throughout this figure, where positive values indicate stabilization upon PUM knockdown and negative values indicate destabilization upon PUM knockdown (see Materials and Methods for details). (B) Five percent truncated average of Pum2 PAR-CLIP read coverage (Hafner et al. 2010) over each PRE site in the 3′-UTRs of genes with a statistically significant change in RNA stability (blue) compared to genes in which there was a statistically significant lack of change in stability (orange; see Materials and Methods for details on NOEFFECT test). Shaded regions represent bootstrapping (n = 1000) within each group. Dashed lines indicate the PRE site. (C) Violin plots representing the distributions of RNA stability for genes with 0 to 15 PRE sites within their 3′-UTR. Stars represent statistical significance as measured by a Wilcoxon rank sum test using equality of pseudomedian with the 0 PRE case as the null hypothesis. (D) Distribution of AU content in a 100 bp window around all unique PRE sites in the 3′-UTRs of the human transcriptome. The observed distribution (red) is compared to the distribution of AU content around PRE sites in 1000 simulated sets of 3′-UTRs the same size as the true set of 3′-UTRs as simulated from a third-order Markov model trained on the true 3′-UTR sequences. The dotted line represents the average overall AU content of the entire set of 3′-UTRs in the human transcriptome. (E) Relationship of AU content in a 100 bp window around a PRE to RNA stability. (Left) Marginal histogram of RNA stability for genes with 0 PREs in their 3′-UTRs. (Right) 2D histogram of RNA stability and AU content around each PRE site for all genes with at least one PRE in the 3′-UTR. Dotted line represents the average AU content over the entire set of 3′-UTRs in the human transcriptome. (Bottom) Marginal kernel density plot of AU content around a PRE site split among genes with a statistically significant change in RNA stability (red) and genes with a statistically significant lack of change in stability (blue). Dotted black line represents the average AU content of 3′-UTRs. Dashed lines represent the median AU content around a PRE for the EFFECT (red) and NOEFFECT (blue) genes. The star represents a statistically significant difference in medians using a one-sided permutation test (n = 1000) of shuffled class labels. (F) Distribution of length-normalized locations of PRE sites in the 3′-UTRs of the human transcriptome. The observed distribution (red) is compared to that of PRE sites found in 1000 simulated sets of 3′-UTRs calculated as in D. (G) Relationship of normalized location of PRE site in 3′-UTR to RNA stability. Plots as in E. (H) Violin plots representing the distributions of RNA stability for genes with 0 to 6 full PRE sites clustered within a 100 bp window. Stars represent statistical significance as measured by a Wilcoxon rank sum test using the 0 PRE case as the null distribution. (I) Comparison of the observed frequencies of PRE site clustering over all possible 100 bp windows in the full set of human 3′-UTRs with at least one PRE in them to the probabilities expected from a Poisson null distribution. Error bars represent 95% confidence intervals based on 1000 bootstraps of the observed distribution.




