


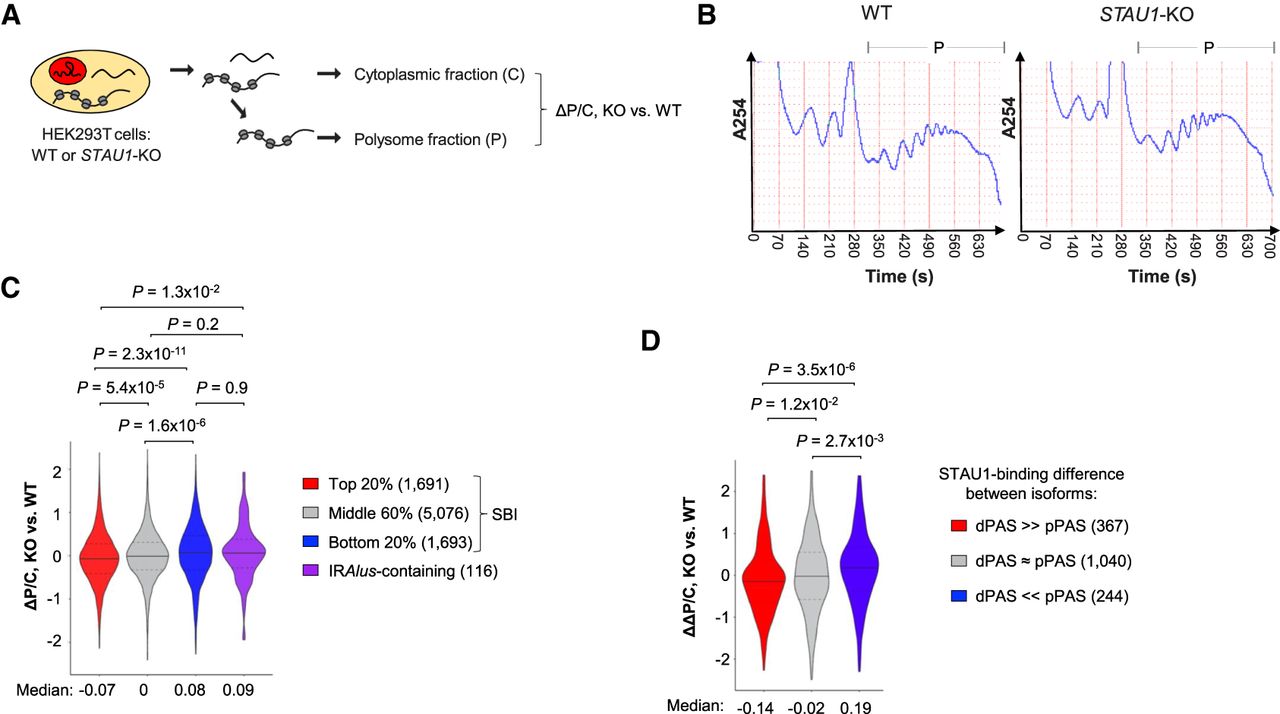
STAU1 binding promotes polysome association of IRAlus-less transcripts. (A) Schematic showing fractionation of WT or STAU1-KO (C8) HEK293T cells for polysome profiling and 3′READS analysis. Polysome association of a transcript is represented by P/C, which is the Log2(Ratio of RPM) for the transcript in the polysomal fraction relative to the cytoplasmic fraction. (B) Polysome profiles of WT (left) or STAU1-KO (right) HEK293T cells. The polysome fraction is indicated by “P.” (C) Violin plot showing P/C data in KO versus WT cells (ΔP/C) for different transcript groups based on SBI. Genes with 3′UTR IRAlus are analyzed as a separate group. Gene numbers are indicated in parentheses. P-values (Wilcoxon test) comparing different groups are shown. (D) Violin plot showing ΔΔP/C of genes, which represents the APA isoform difference in ΔP/C (KO vs. WT). Different groups of genes based on SBI difference between 3′UTR isoforms are shown. Gene numbers are indicated in parentheses. P-values (Wilcoxon test) comparing different groups are shown.




