


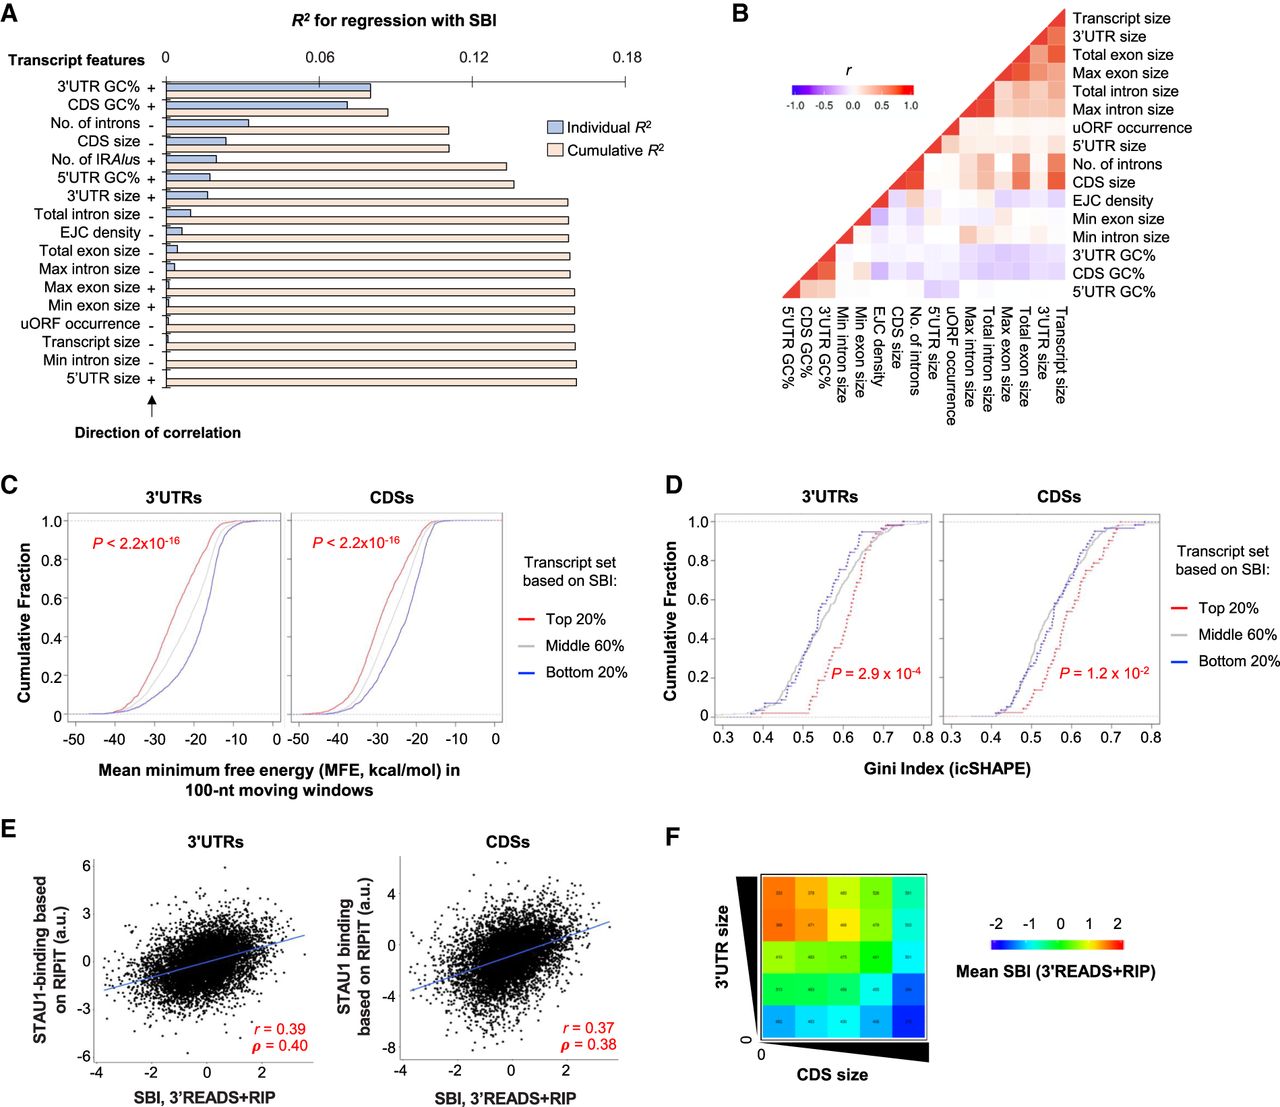
Transcript features related to STAU1 binding. (A) Bar graph showing individual and cumulative coefficients of determination (R2) of transcript features for SBIs using a linear regression model. GC%, GC content; Max and Min refer to the largest and smallest exon or intron of a gene, respectively. +, positive correlation; −, negative correlation. Individual R2 is for a given transcript feature, and Cumulative R2 is for a combination of a given feature as well as all other features with a higher individual R2. Only the most abundant transcript per gene was used for this analysis and other analyses in this figure. (B) Correlation between individual features. Pearson correlation coefficient (r) is shown in a heatmap according to the indicated color scheme. (C) Cumulative fraction function curves of minimum free energy (MFE) by Mfold analysis, predicting the stability of RNA structures in the 3′UTR (left) and CDS (right) of genes grouped by SBI, including top 20%, middle 60%, and bottom 20%. (D) Cumulative fraction function curves of the Gini coefficient measuring the degree of RNA structures identified by icSHAPE analysis in the 3′UTR (left) and CDS (right) of genes grouped by SBI, as in panel C. (E) Correlation between SBI (3′READS + RIP) and a STAU1-binding score based on RIPiT data. The RIPiT score was individually calculated for 3′UTRs (left, 7907 genes) and CDSs (right, 8312 genes). Pearson correlation coefficient (r) is indicated in each comparison. a.u., arbitrary units. (F) Heatmap showing SBIs for genes grouped by 3′UTR size (y-axis) and CDS size (x-axis). Genes were divided into five equally sized bins based on each axis, resulting in 25 groups. The number of genes in each group is indicated, and the mean SBI for each group is represented by color based on the color scheme shown in the graph.




