


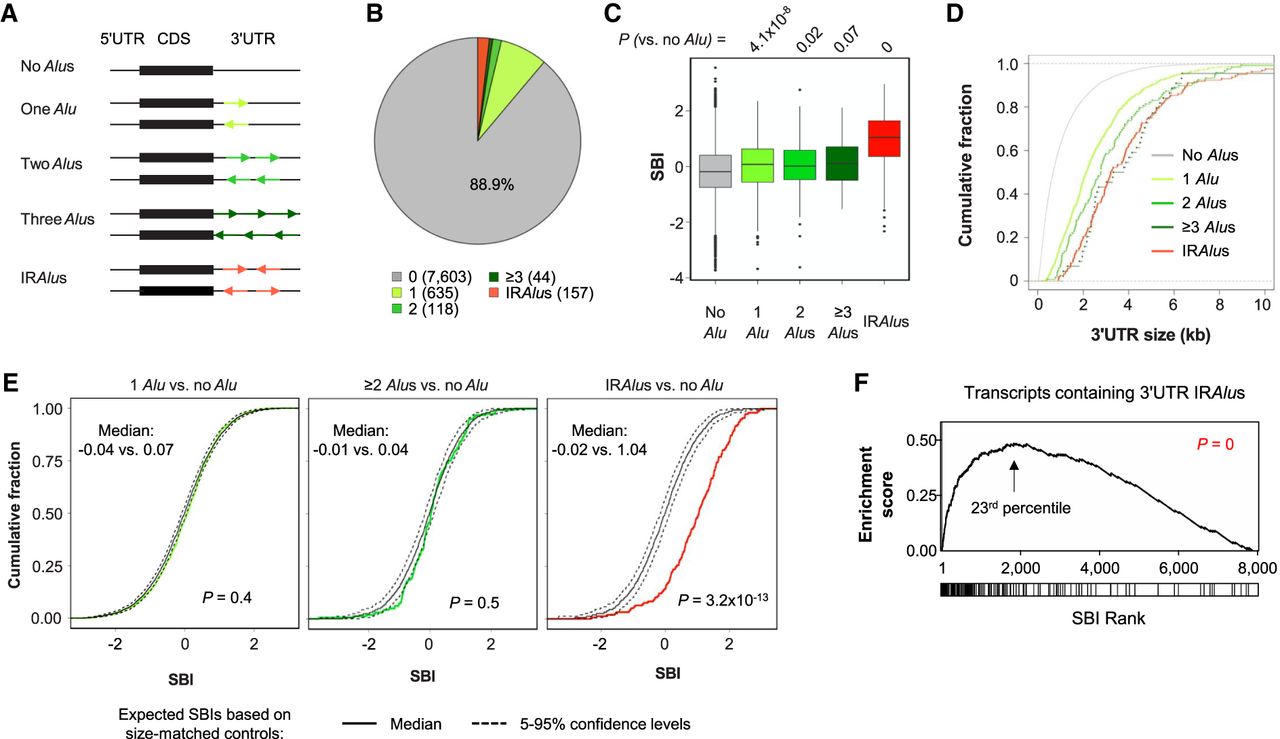
Alu-containing 3′UTRs and STAU1 binding. (A) Schematic showing different types of transcripts based on the number and orientation of Alus in their 3′UTR. Each group is specified by a different color. (B) Pie chart showing the percentage of transcripts harboring the different 3′UTR Alus configurations illustrated in panel A in all IP and input samples. The number of transcripts constituting each type is indicated in parentheses. (C) Boxplot of the SBIs for the different groups of transcripts in panel A. P-values (Wilcoxon test) comparing different groups with the “No Alu” group are indicated. (D) Cumulative fraction function curves of 3′UTR sizes for the different groups of transcripts in panel A. (E) Cumulative fraction function curves of SBIs of different groups with 3′UTR-size-matched control transcripts. Colored line in each plot corresponds to observed SBIs of a specific group of transcripts. Solid black line corresponds to expected SBIs based on bootstrapped transcripts with similar 3′UTR sizes. The bootstrapping process was repeated 100 times. Dotted black lines position the 0.05 or 0.95 percentile of bootstrapped SBIs. P-values (K–S test) comparing observed and expected SBIs, and their individual medians are shown. (F) Gene set enrichment analysis of 3′UTR IRAlus-containing transcripts based on SBI. Transcripts are ranked based on their SBIs. Transcripts containing 3′UTR IRAlus are marked by a vertical line in the box under the graph. The 23rd-percentile is the point at which the enrichment reaches the peak. P-value (K–S test comparing IRAlus-containing and other transcripts) indicating significance of enrichment toward high SBI values is indicated.




