


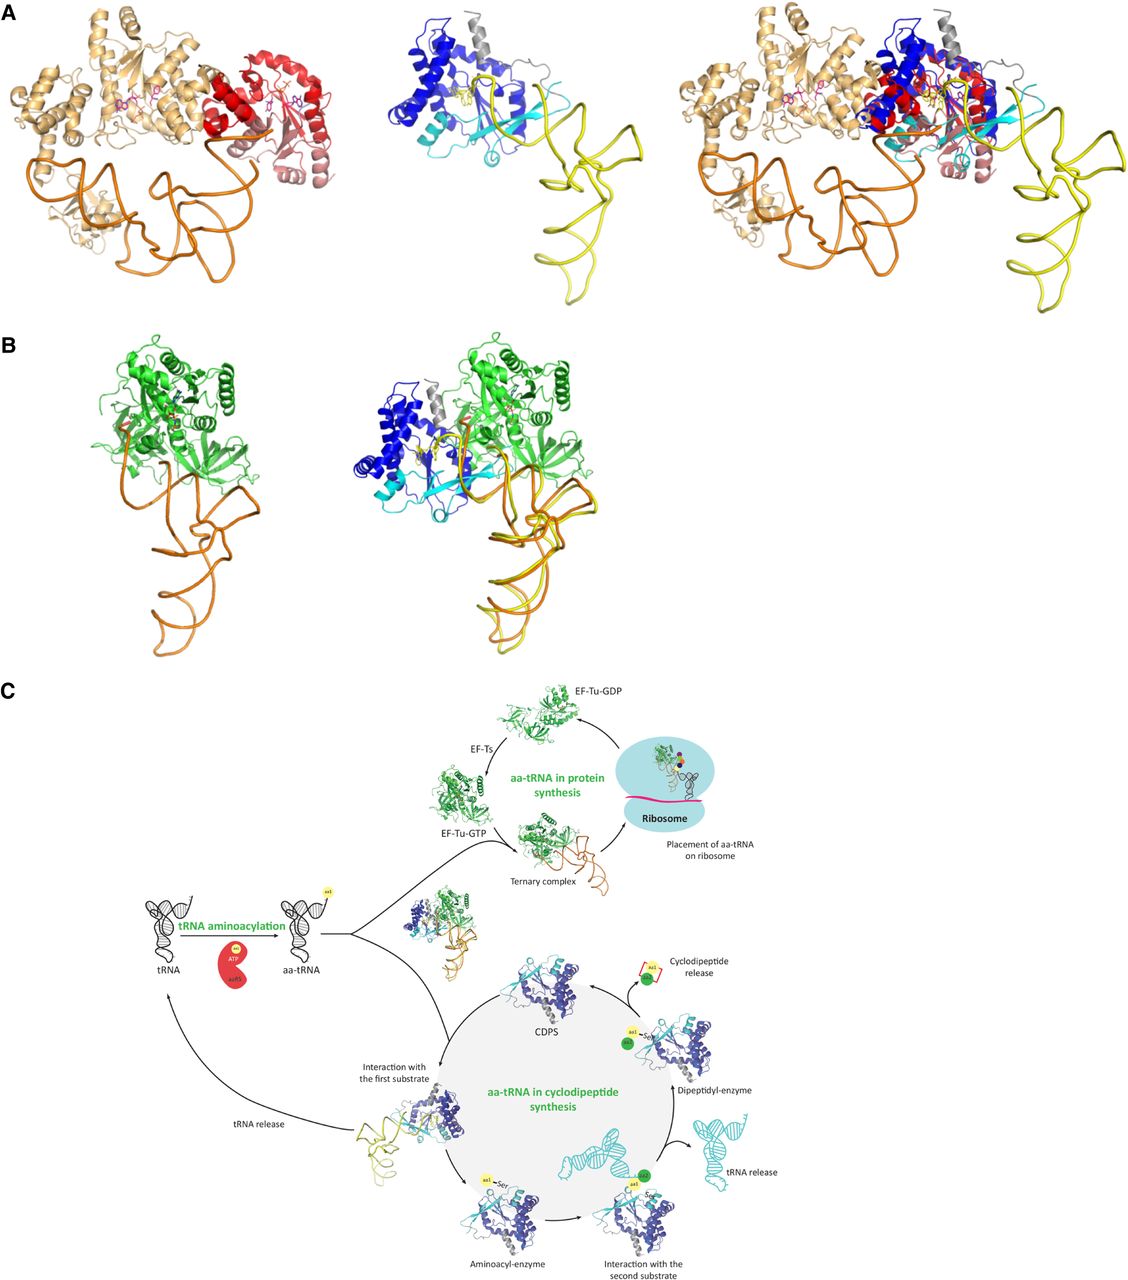
Comparison of tRNA binding modes. (A) Structural alignment of Rgry-CDPS:Phe-tRNAPhe with T. thermophilus TyrRS:tRNATyr. Left view, the T. thermophilus TyrRS:tRNATyr complex is represented in cartoon (PDB ID Code 1H3E, Yaremchuk et al. 2002). One monomer is in light orange and the amino-terminal domain of the second monomer is in colored in light red (first part of the Rossmann fold) and in dark red (second part of the Rossmann fold). ATP and tyrosine are shown in sticks. Middle view, Rgry-CDPS:Phe-tRNAPhe model. Phe-A76 and C75 are shown in yellow sticks. The color code is the same as in Figure 5. Right view, superimposition of the two structures. The view shows that the tRNA binding mode is different for Rgry-CDPS and for TyrRS even if the two enzymes have similar catalytic domain (the Rossmann fold of the two enzymes superimpose with an rmsd = 3.5 Å for 159 matched Ca positions). (B) Comparison of Phe-tRNAPhe binding to EF-Tu and to Rgry-CDPS. Left view, T. thermophilus EF-Tu:GDPNP:Phe-tRNAPhe complex (PDB ID Code 1TTT, Nissen et al. 1995). Middle view, the Phe-tRNAPhe molecules of the EF-Tu:GDPNP:Phe-tRNAPhe and Rgry-CDPS:Phe-tRNAPhe complexes were superimposed. The view shows how EF-Tu and Rgry-CDPS interact with different parts of the Phe-tRNAPhe molecule. (C) Hijacking of elongator tRNAs by CDPSs. The figure shows that aa-tRNAs are diverted from their canonical role in ribosomal protein synthesis to catalyze the formation of two peptide bonds leading to the production of cyclodipeptides.




