


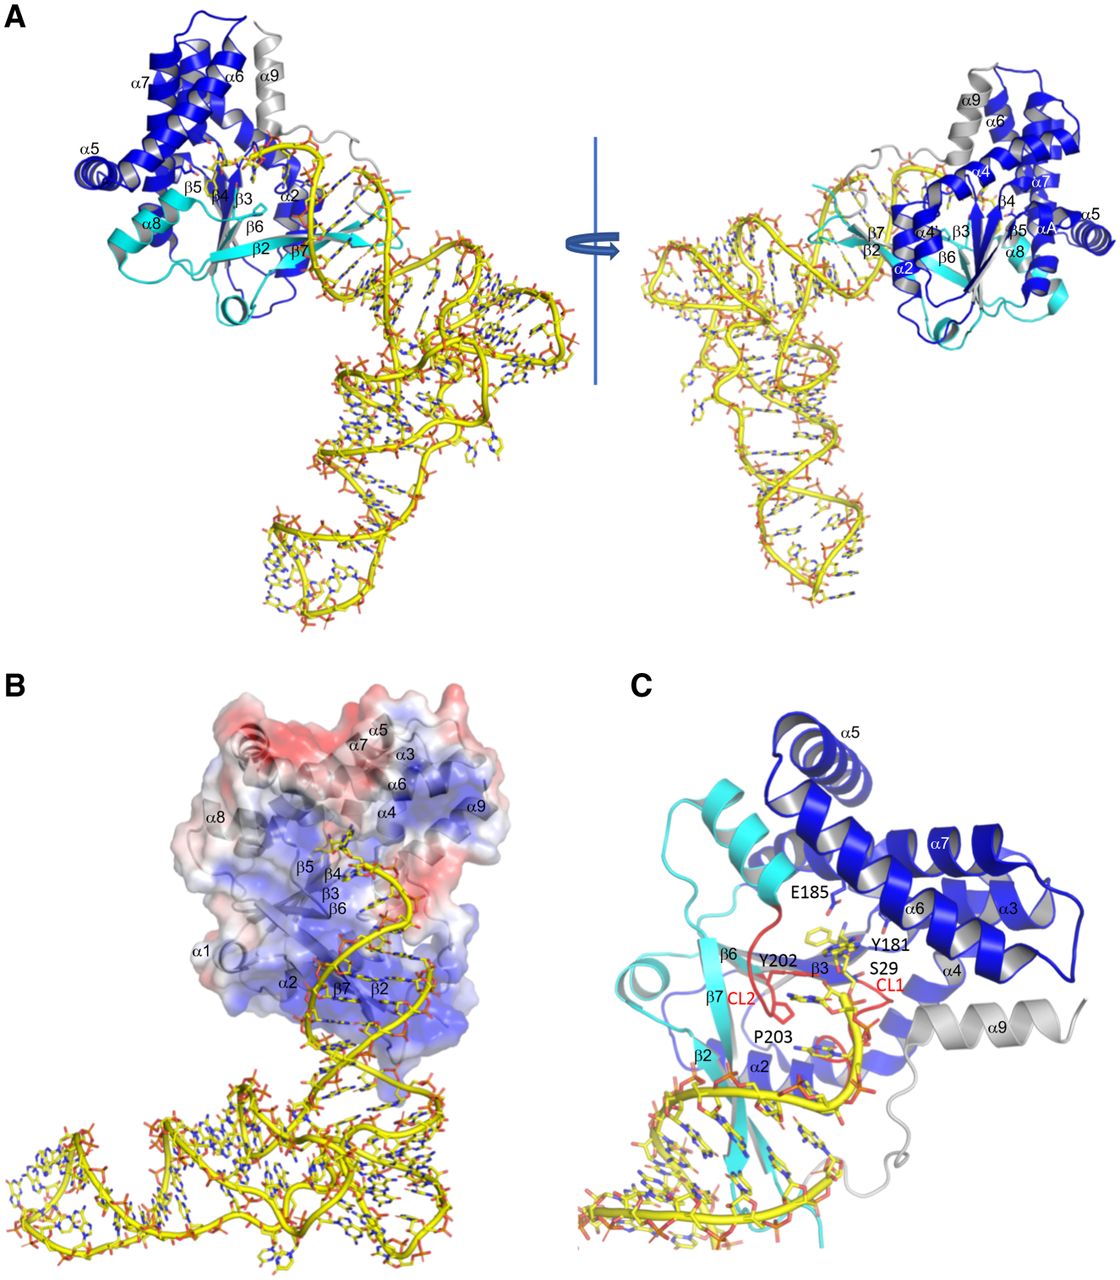
Model of the Rgry-CDPS:Phe-tRNAPhe complex. (A) The structure of Rgry-CDPS refined at 2.0 Å resolution (PDB: 5MLP, Bourgeois et al. 2018) was superimposed onto that of Cglo-CDPS to deduce a model of Rgry-CDPS:Phe-tRNAPhe. The color code is the same as in Figure 5. The carboxy-terminal helix of Rgry-CDPS is in gray. The two structures are superimposed with an rmsd of 2.03 Å for 194 Ca atoms compared. (B) Electrostatic potential map of Rgry-CDPS (blue, positive; red, negative; white, neutral) with the tRNA shown in yellow sticks and cartoon. The views emphasize the binding of the acceptor arm of the tRNA by the positively charged protein area containing β2–β7 (see also Supplemental Fig. S4). The electrostatic potential map was calculated using the APBS plugin in Pymol (Schrodinger 2017). (C) Closeup of the catalytic center in the Rgry-CDPS:Phe-tRNAPhe model. Figures 1, 5–7 were drawn with Pymol.




