


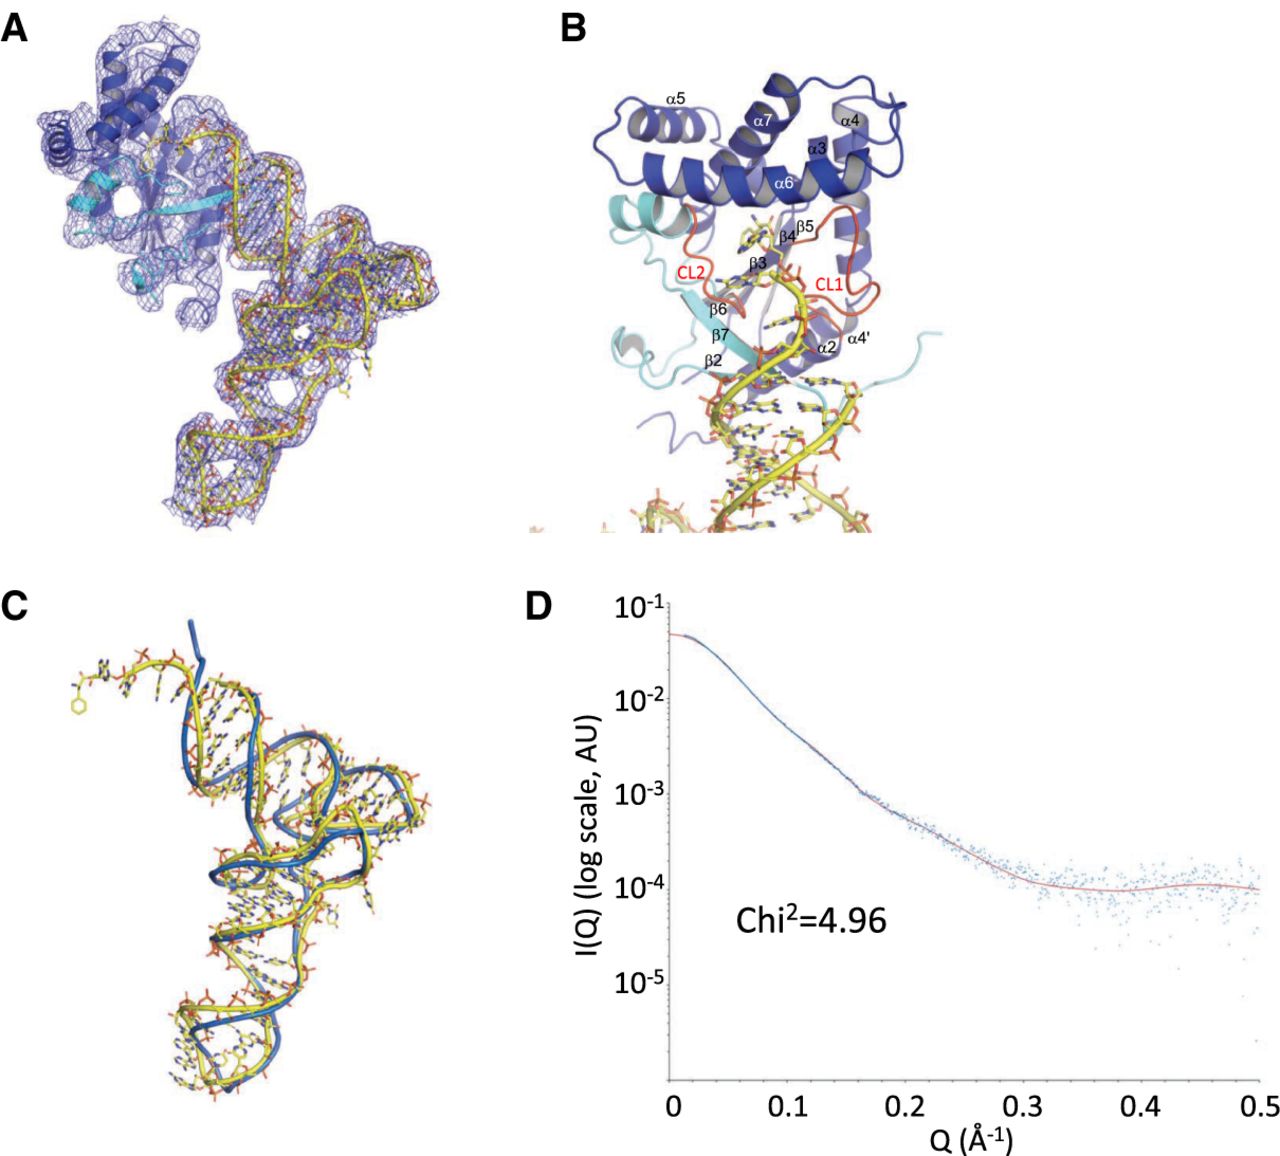
FIGURE 5.
Structure of the Cglo-CDPS:Phe-tRNAPhe complex. (A) Cglo-CDPS-S32A:Phe-tRNAPhe complex. The first half of the Rossmann fold is colored in cyan and the second half is in dark blue. The 2mFo − DFc electron density map is contoured at 1 sigma. (B) Closeup of the catalytic center. The two catalytic loops CL1 and CL2 (see Fig. 1) are colored in red. (C) Superimposition of free tRNAPhe onto Phe-tRNAPhe in the Cglo-CDPS-S32A:Phe-tRNAPhe complex. (D) The experimental SAXS curve (blue) is compared with the theoretical diffusion curve deduced from the crystal structure of the Cglo-CDPS-S32A:Phe-tRNAPhe complex (red). AU, arbitrary units. See also Supplemental Figure S6.




