


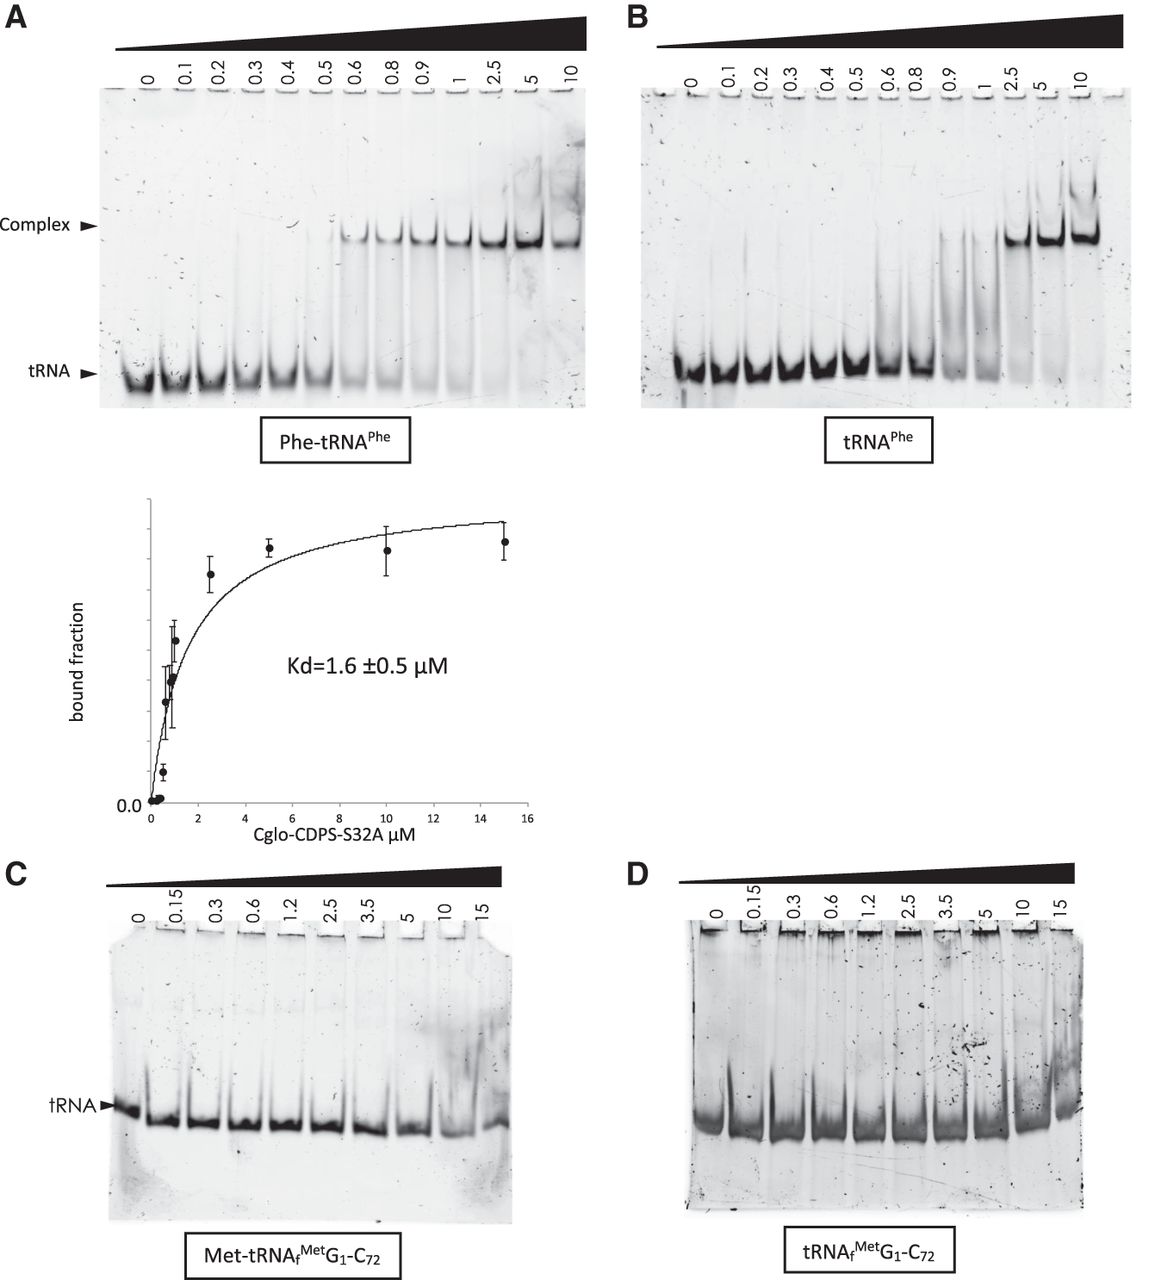
Electrophoretic mobility shift assays of Cglo-CDPS-S32A:tRNA mixtures. (A) Cglo-CDPS-S32A was incubated at increasing concentrations (0.1–15 µM) with 75 nM Phe-tRNAPhe and electrophoresed on a native acrylamide gel. The panels show typical experiments. All gels were stained using SYBR gold (Invitrogen) and then Coomassie blue. The curve below the gel corresponds to a plot of the intensity of the bound fraction as a function of enzyme concentration. It was fitted according to a simple binding equilibrium. A KD value of 1.6 ± 0.5 µM was deduced from three independent experiments. (B) Same experiment as that in A, with 75 nM of tRNAPhe. No KD value was derived because tRNA dissociation from CDPS is visible during migration. (C) Same experiment as that in A, with 75 nM Met-tRNAMet. (D) Same experiment as that in A, with 75 nM tRNAMet.




