


FIGURE 3.
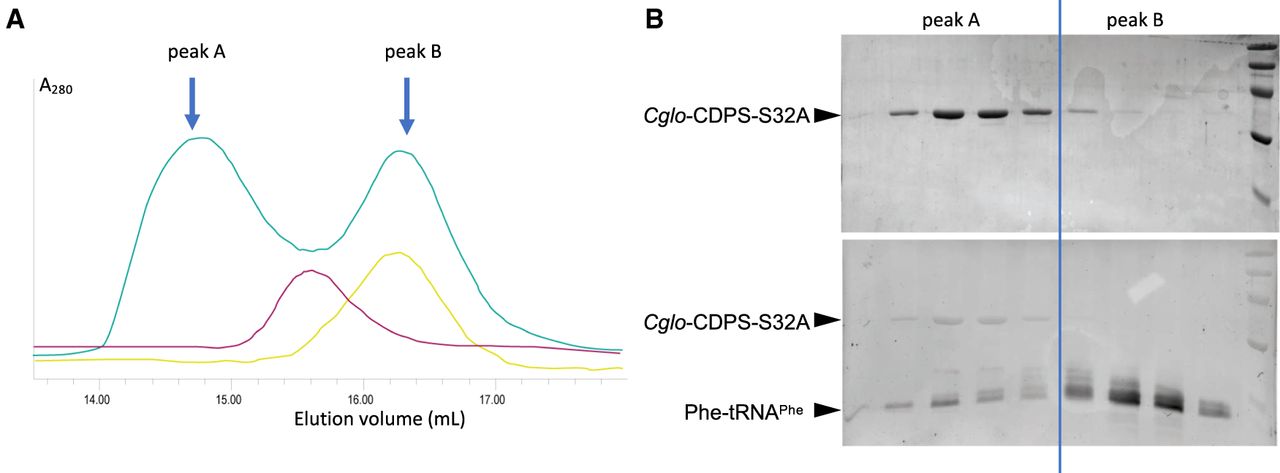
Gel filtration analysis of Cglo-CDPS:aa-tRNA mixtures. (A) Gel filtration chromatograms for Cglo-CDPS-S32A (pink), Phe-tRNAPhe (yellow), Cglo-CDPS-S32A:Phe-tRNAPhe mixture (green). (B) SDS-PAGE analysis of fractions from peak A and peak B. Gels were stained using ethidium bromide (lower part) and then Coomassie blue (upper part). The molecular weight marker (GE-Healthcare) is shown to the right of the gel. Visible bands correspond to proteins with molecular weights of 97, 66, 45, 30, 20 kDa from top to bottom. Experimental conditions are described in the Materials and Methods section.




