


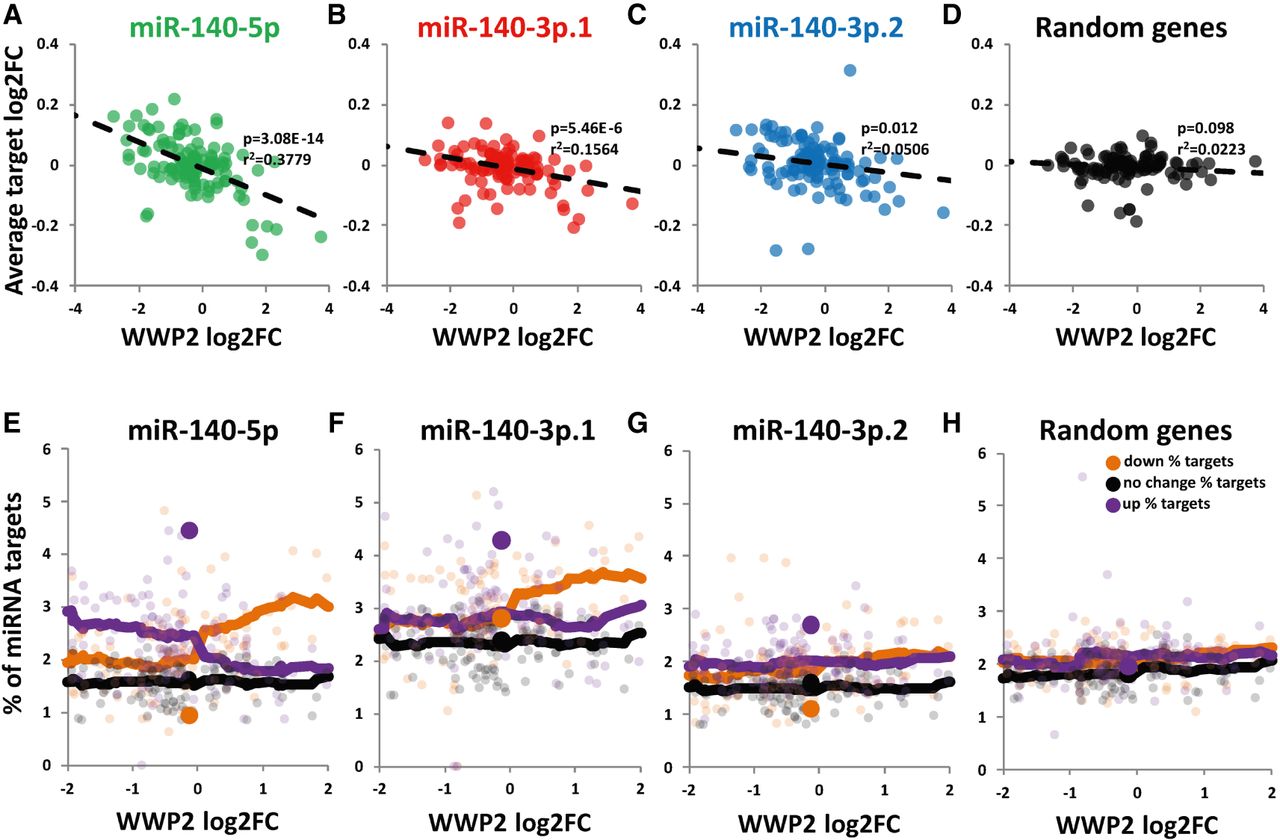
Correlation of MIR140 locus host gene WWP2 with miR-140 target genes in SkeletalVis transcriptomic data sets. (A–D) Correlation analysis of WWP2 and predicted miRNA target expression in 124 preexisting transcriptome-wide comparisons (both human and mouse). Scatter graph of WWP2 log2FC plotted against the average log2FC for genes predicted to be either a target of miR-140-5p (A), miR-140-3p.1 (B), miR-140-3p.2 (C), or 500 random genes (D), P-value calculated from linear regression analysis. (E–H) Percentage of miR-140-5p (E), miR-140-3p.1 (F) or miR-140-3p.2 (G) predicted targets and 500 random genes (H) within the significantly up- or down-regulated genes for data sets where WWP2 expression significantly changes. The percentage of targets within up-regulated (purple), no change (black), or down-regulated (orange) transcripts is plotted against log2FC WWP2. Large icons represent enrichment of miR-140-5p, miR-140-3p.1, and miR-140-3p.2 predicted targets in up- and down-regulated genes within rib cartilage of Mir140-null mice, where Wwp2 expression does not change.




