


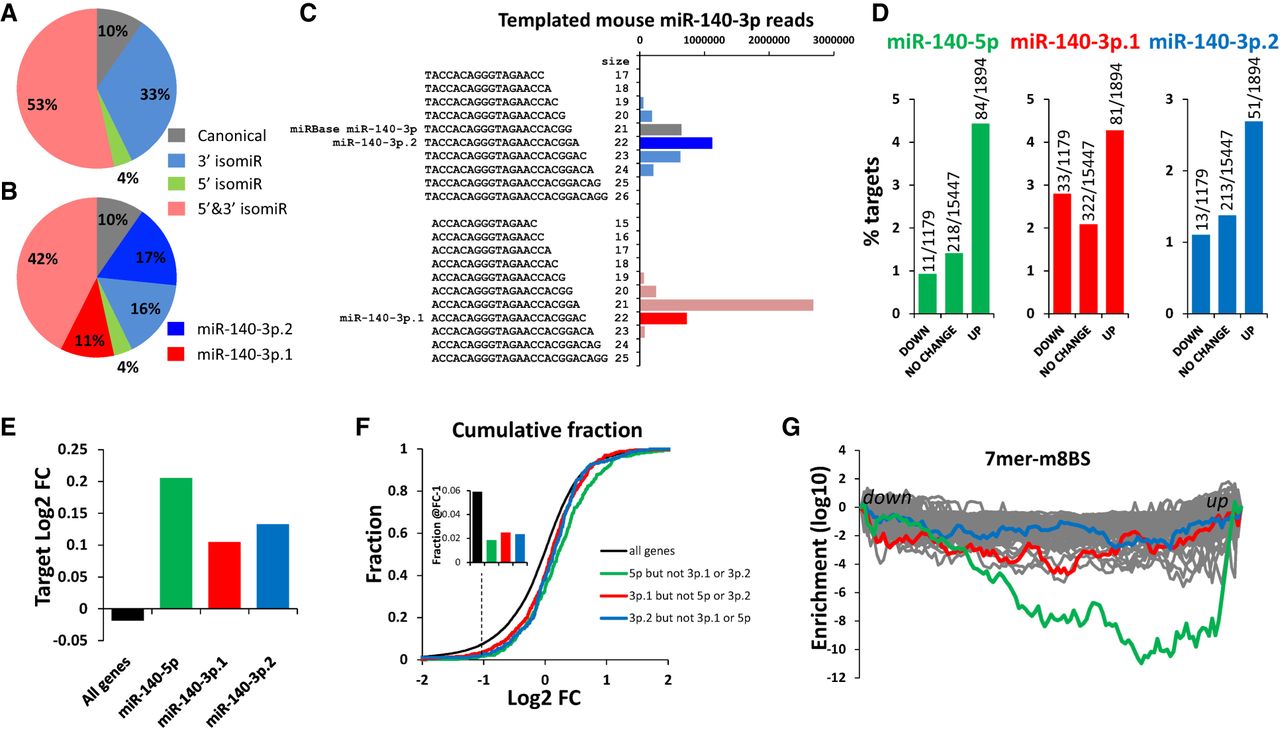
Evidence for functional miR-140-3p.1 and miR-140-3p.2 in mouse cartilage. (A) Pie chart illustrating the fraction of miR-140-3p reads with canonical 5′ and 3′ ends (gray), canonical 5′ and either shorter or longer 3′ (blue), canonical 3′ and either shorter or longer 5′ (green), either shorter or longer 5′, and either shorter or longer 3′ (red). (B) As in (A) with miR-140-3p.1 and miR-140-3p.2 indicated in dark red and dark blue, respectively. (C) Bar chart indicting number of reads that contribute to (B). (D) % of genes that are predicted targets of either a miR-140-5p (green), miR-140-3p.1 (red), or miR-140-3p.2 (blue), in genes whose expression decrease, does not change or increase following KO of miR-140 in mice. (E) Median fold change (FC) of all genes that are predicted targets of either a miR-140-5p (green), miR-140-3p.1 (red), or miR-140-3p.2 (blue) following KO of miR-140 in mice. (F) Cumulative fraction plot of all genes (black), miR-140-5p (green), miR-140-3p.1 (red), or miR-140-3p.2 (blue) predicted targets, for genes ordered from most decreased expression to most increased expression in Mir140-null mice. (Inset) Fraction at a cut-off of log2FC-1. (G) Sylamer analysis for Mir140-null mice; the 100 most enriched 7mers are shown with 7m8 binding sites for miR-140-5p (green), miR-140-3p.1 (red), and miR-140-3p.2 (blue) highlighted.




