


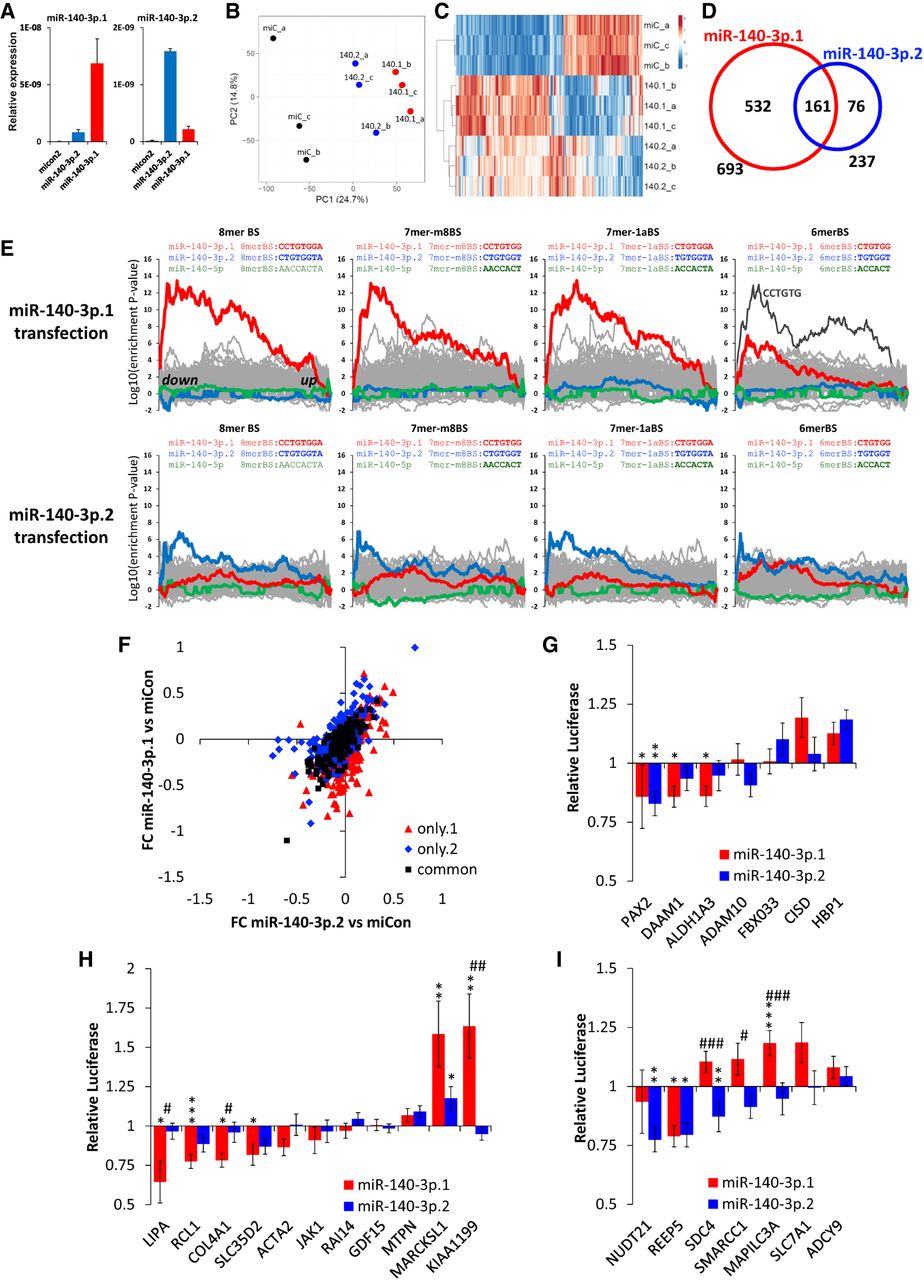
Identification and validation of miR-140-3p.1 and miR-140-3p.2 targets in human chondrocytes. (A) qRT-PCR for miR-140-3p.1 and miR-140-3p.2 following transfection of either control mimic, miR-140-3p.1 mimic or miR-140-3p.2 mimic for 48 h. (B) PCA of whole genome micro-array following transfection of mimics described in (A), (140.1 = miR-140-3p.1 and 140.2 = miR-140-3p.2). (C) Heat map of whole genome micro-array following transfection of mimics as described in (A) (140.1 = miR-140-3p.1 and 140.2 = miR-140-3p.2). (D) Venn diagram indicating the number of genes down-regulated following overexpression of miR-140-3p.1 and miR-140-3p.2. (E) Enrichment analysis using Sylamer for 3′UTR mRNA motifs complementary to either miR-140-3p.1 or miR-140-3p.2 seed sequences in genes whose expression decreased following transfection of either miR-140-3p mimic, miR-140-3p.1 mimic, or miR-140-3p.2 mimic. (F) Gene expression changes of miR-140-3p.1 (only.1; red triangles), miR-140-3p.2 (only.2; blue diamonds), or miR-140-3p.1 and miR-140-3p.2 (common; black squares) predicted targets following transfection of either miR-140-3p.1 mimic or miR-140-3p.2 mimic. (G–I) 3′UTR luciferase reporters for both miR-140-3p.1 and miR-140-3p.2 (G), miR-140-3p.1 (H), or miR-140-3p.2 (I) putative targets. (*), (**), or (***) indicate level of significance (P < 0.05, 0.01, or 0.001, respectively) of either miR-140-3p.1 or miR-140-3p.2 to control. # indicates level of significance (P < 0.05, 0.01, or 0.001, respectively) between miR-140-3p.1 and miR-140-3p.2.




