


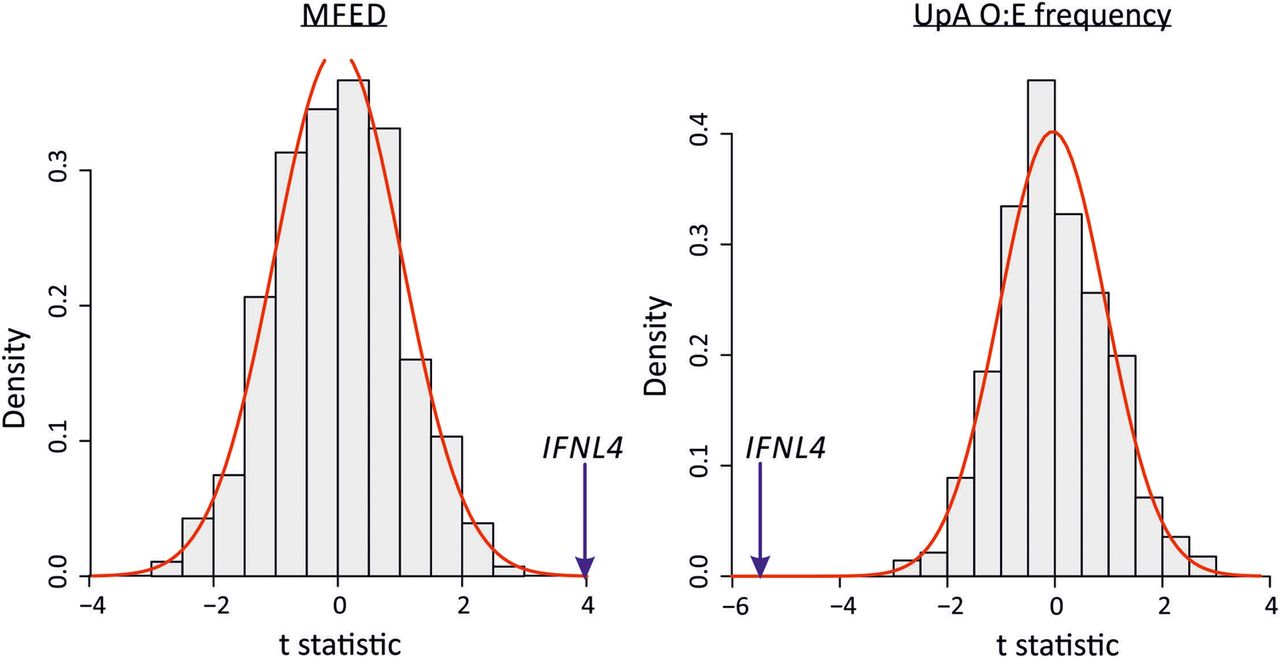
FIGURE 9.
Association of MFED values and UpA frequencies with the IFNL4 SNP rs12979860. The distribution of the t-statistics for 500 SNPs from across the genome frequency matched to the IFNL4 SNP rs12979860 (SNPs listed in Supplemental Table S2; Supplemental Data). The red line shows the fitted normal distribution to the data. The t-statistic is from a linear regression where the dependent variable is the MFED or UpA frequency and the independent variable is the SNP with a dominant genetic model (coded the same as IFNL4 SNP rs12979860 CC vs. non-CC genotypes). The blue arrows indicate the t-statistic for the IFNL4 SNP rs12979860 CC vs. non-CC genotypes.




