


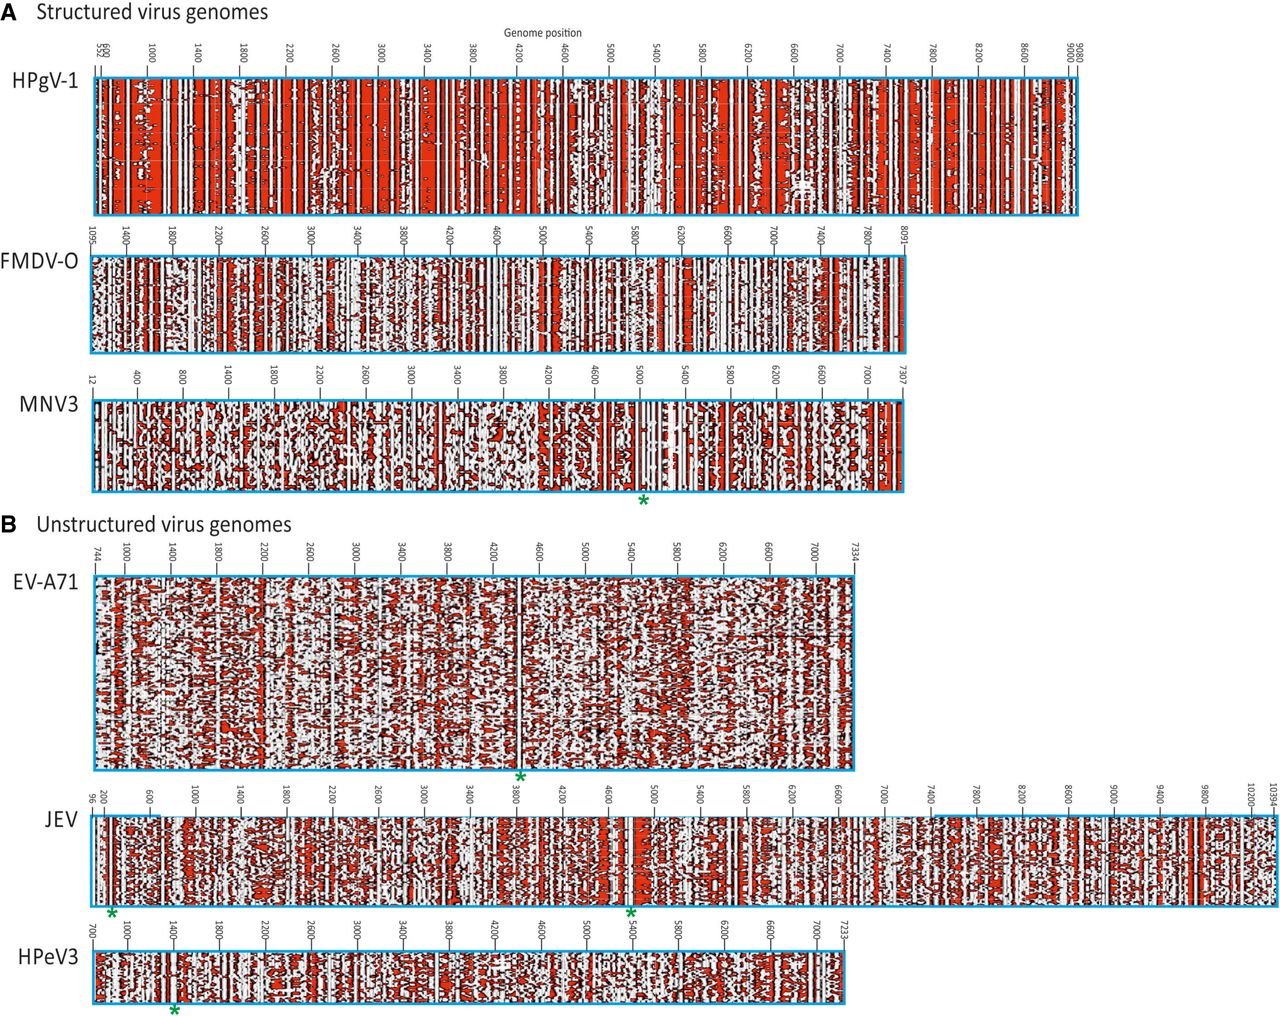
FIGURE 4.
Contour plots of other structured and unstructured virus genomes. Comparison of contour plots of (A) structured (MFED > 5%) and (B) unstructured (MFED < 2%) virus groups plotted to scale. These show similar levels of sequence diversity (8%–15%; Table 1). Previously documented structures indicated by asterisks—EV-A71: cis-replication element (Rieder et al. 2000; Goodfellow et al. 2003); JEV: core region stem–loops; MNV: subgenomic promoter (Simmonds et al. 2008); HPeV: cis-replication element (Al Sunaidi et al. 2007).




