


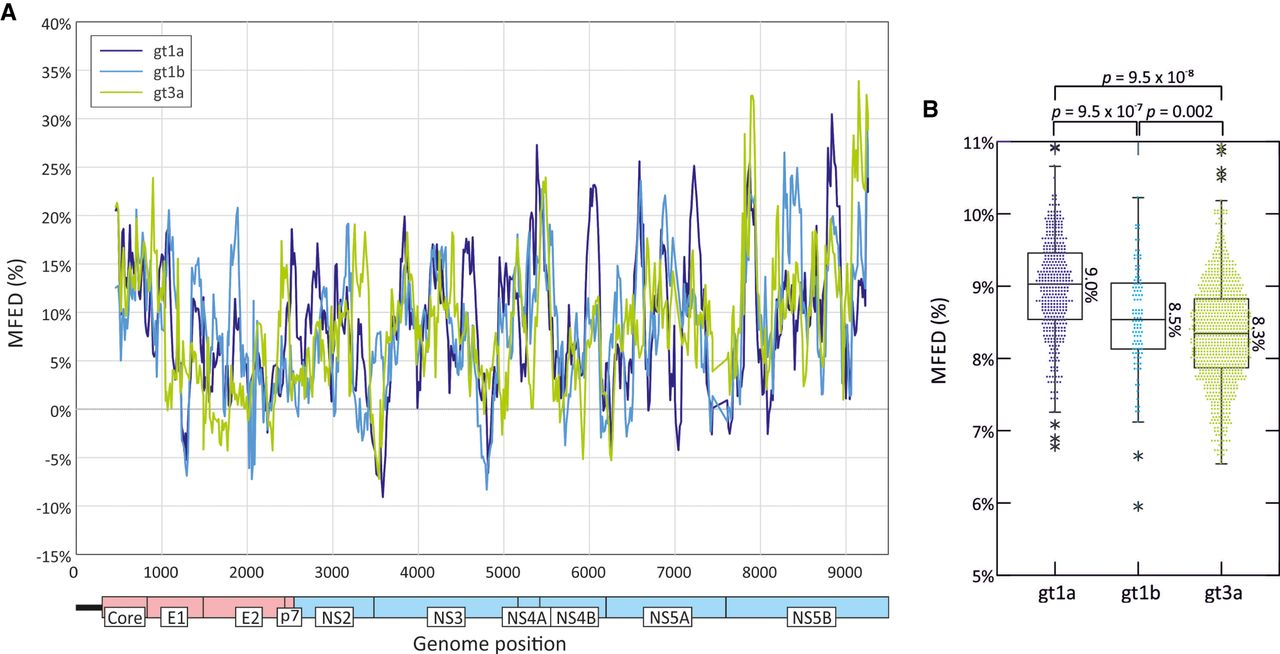
MFED differences in HCV coding regions of genotypes 1a, 1b, and 3a. MFED values were calculated for consecutive 240 base fragments, incrementing by 15 bases across the HCV coding region (569 fragments). MFED values were calculated by subtraction of the MFE of the native sequence by the mean value of 49 sequence order randomized controls. (A) Mean values of genotypes 1a (n = 388), 1b (n = 106), and 3a (n = 855) sequences plotted by genome position. (B) Mean values of sequence fragments for individual polyprotein sequences of gts 1a, 1b, and 3a. The box plots show (from the top) 2 standard deviations (SDs) above mean, 1 SD above mean, mean, 1 SD below mean, and 2 SDs below mean; stars represent outliers outside this range. Genome positions were normalized by reference to the H77 prototype sequence, AF011751 (coding region positions 342–9377). Distributions of MFED values of different genotypes were compared by Kruskall–Wallace nonparametric test; P-values on comparing 1a with 1b, 1a with 3a, and 1b with 3a are shown above graph.




