αβDCA method identifies unspecific binding but specific disruption of the group I intron by the StpA chaperone

(Downloading may take up to 30 seconds. If the slide opens in your browser, select File -> Save As to save it.)

Click on image to view larger version.

FIGURE 6.
FIGURE 6.

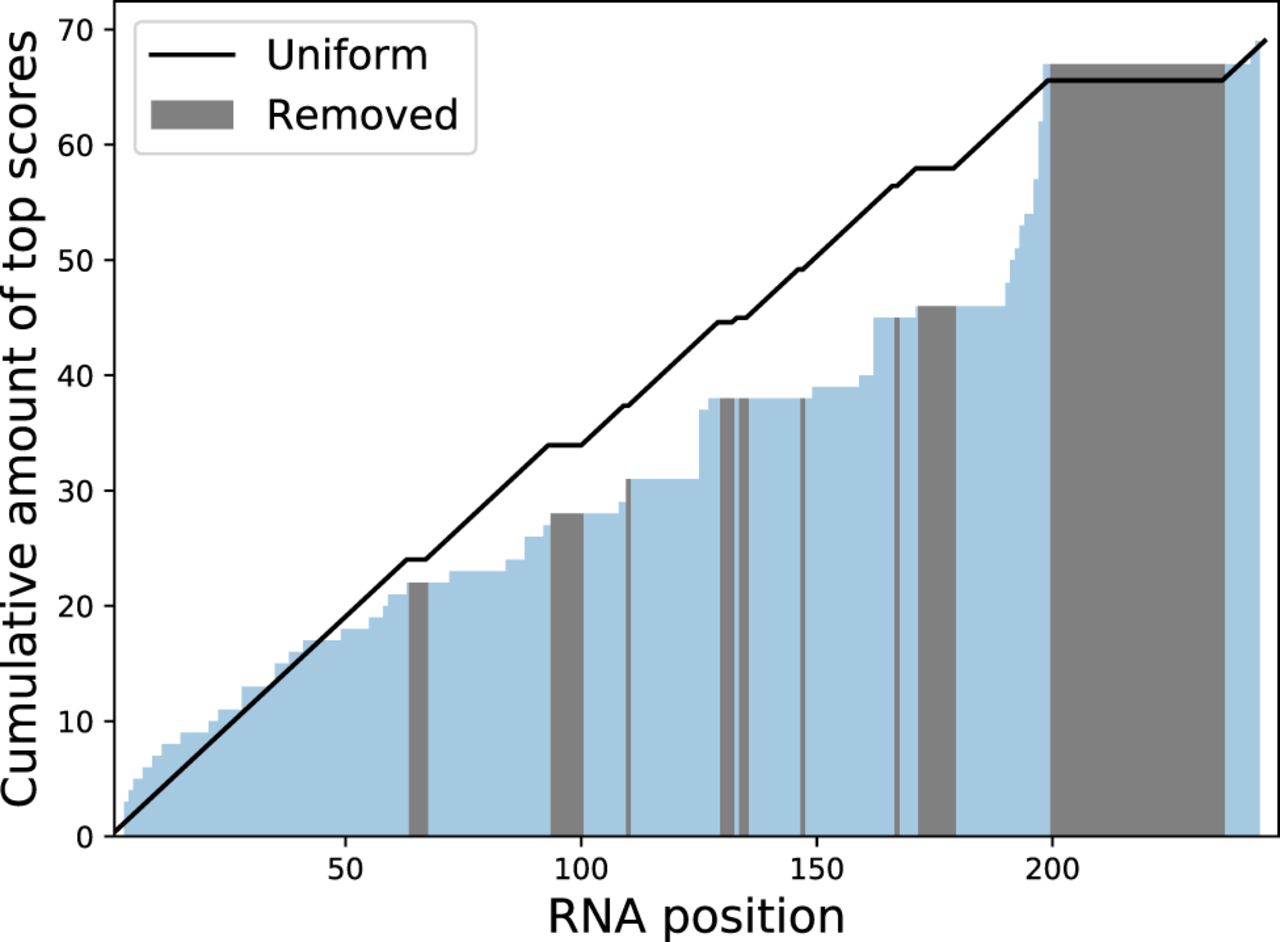
Cumulative distribution of top DCA scores of amino acids in the carboxyl terminal of StpA coupled with nucleotides along the RNA. Positions with >50% of gaps omitted from the analysis are in gray. The black curve is the cumulative uniform distribution with the same gaps.

This Article

  1. RNA 26: 1530-1540

