


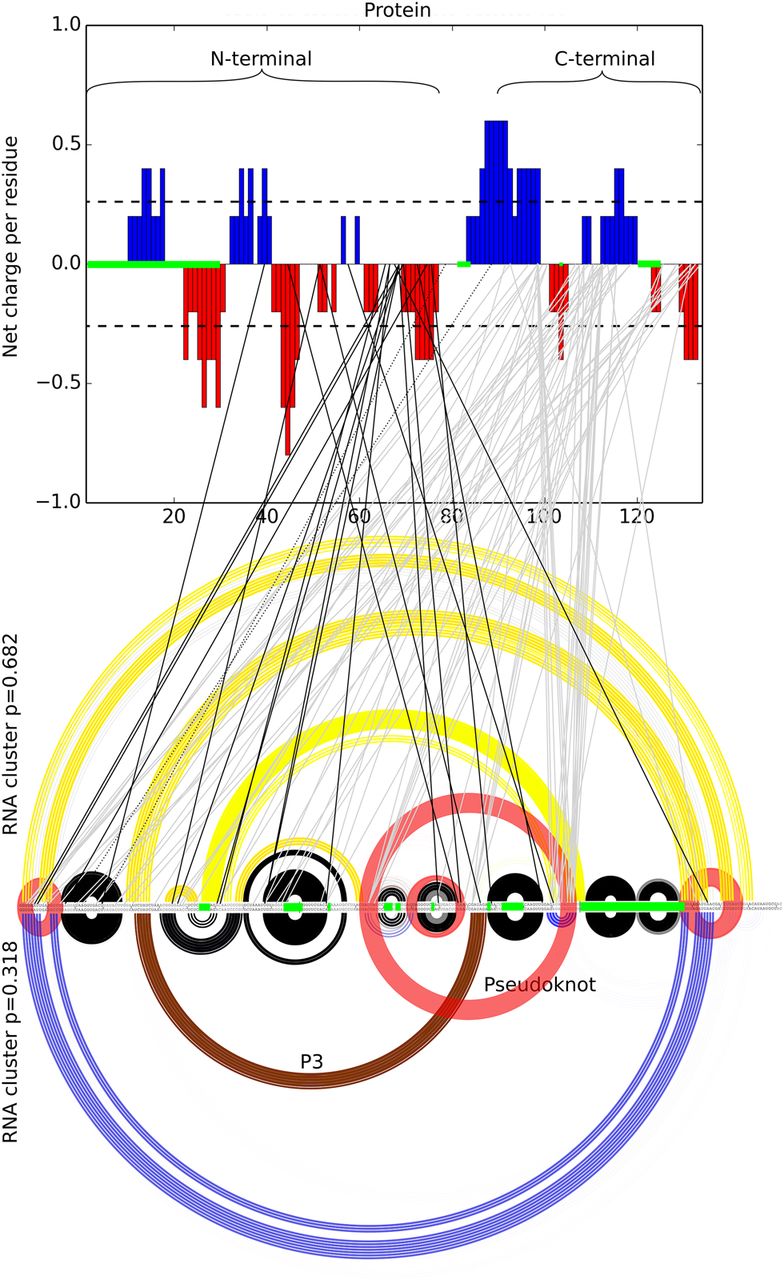
Significant scores between the protein and the RNA. (Top) The protein charge distribution. (Bottom) The RNA sequence with the two main structure clusters. Arcs represent base pairs: yellow only in the main, most probable cluster, blue only in the secondary, least probable cluster, and black in the functional structure. Red discs are base pairs in the functional structure absent from both clusters. Brown arcs are the P3 stem. Positions highlighted in green in the protein and RNA had > 50% of gaps in the alignment and were therefore omitted from the analysis. Significant DCA scores are denoted by lines: dark between the amino-terminal and the RNA, light gray lines between the carboxy-terminal and the RNA.




