


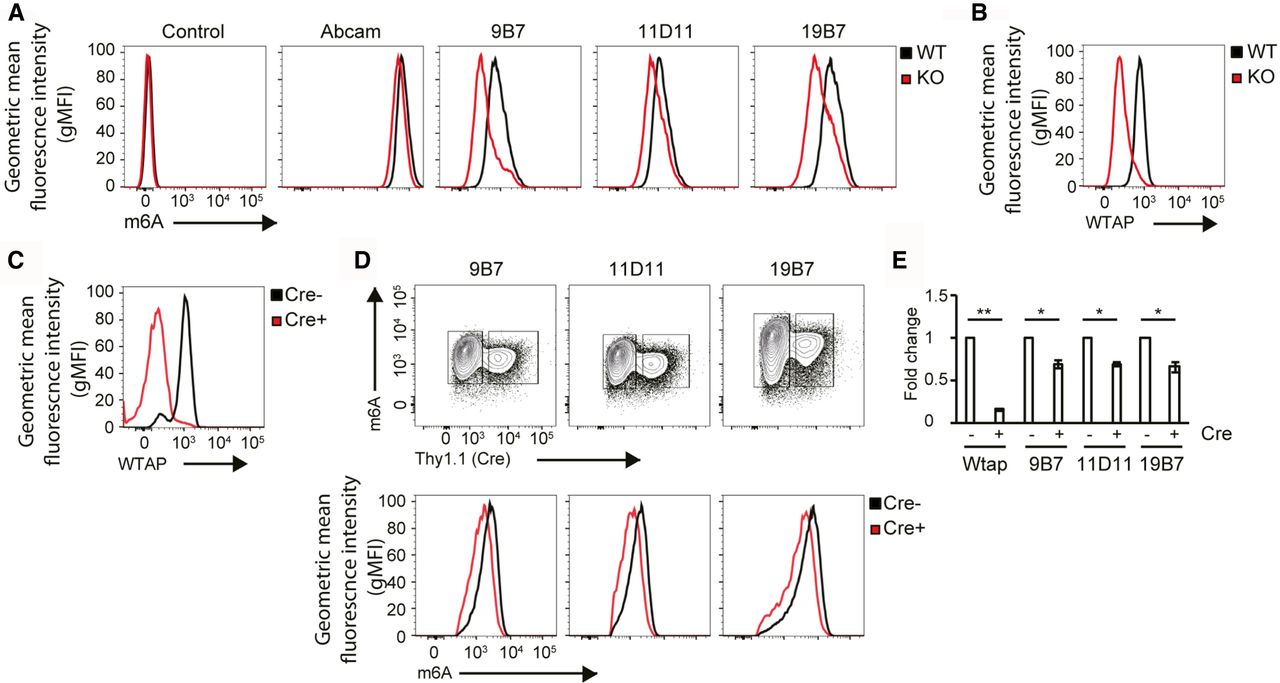
(A) Flow cytometry comparison of MEF cells stained with purified anti-m6A-specific rat monoclonal antibodies or polyclonal commercial anti-m6A antibodies (Abcam). Staining with a secondary anti-rat antibody served as a negative control. Data are representative of three independent experiments. (B,C) Deletion of Wtap in Wtap−/− MEF cells after puromycin selection (B) or acute deletion via Cre transduction of MEF cells at Day 4 (C) was confirmed via anti-Wtap staining. (D,E) Flow cytometry analysis of m6A and Thy1.1 (Cre) in Cre-transduced MEF cells Day 7 is shown as contour plot (D, upper panel) indicating the gates used to overlay m6A levels that are present in the Thy1.1 positive (D, lower panel, red) and Thy1.1 negative (D, lower panel, black) cells. (E) The fold change of the geometric mean fluorescence intensity (gMFI) of Wtap (C) or m6A (D, lower panel) is shown.




