


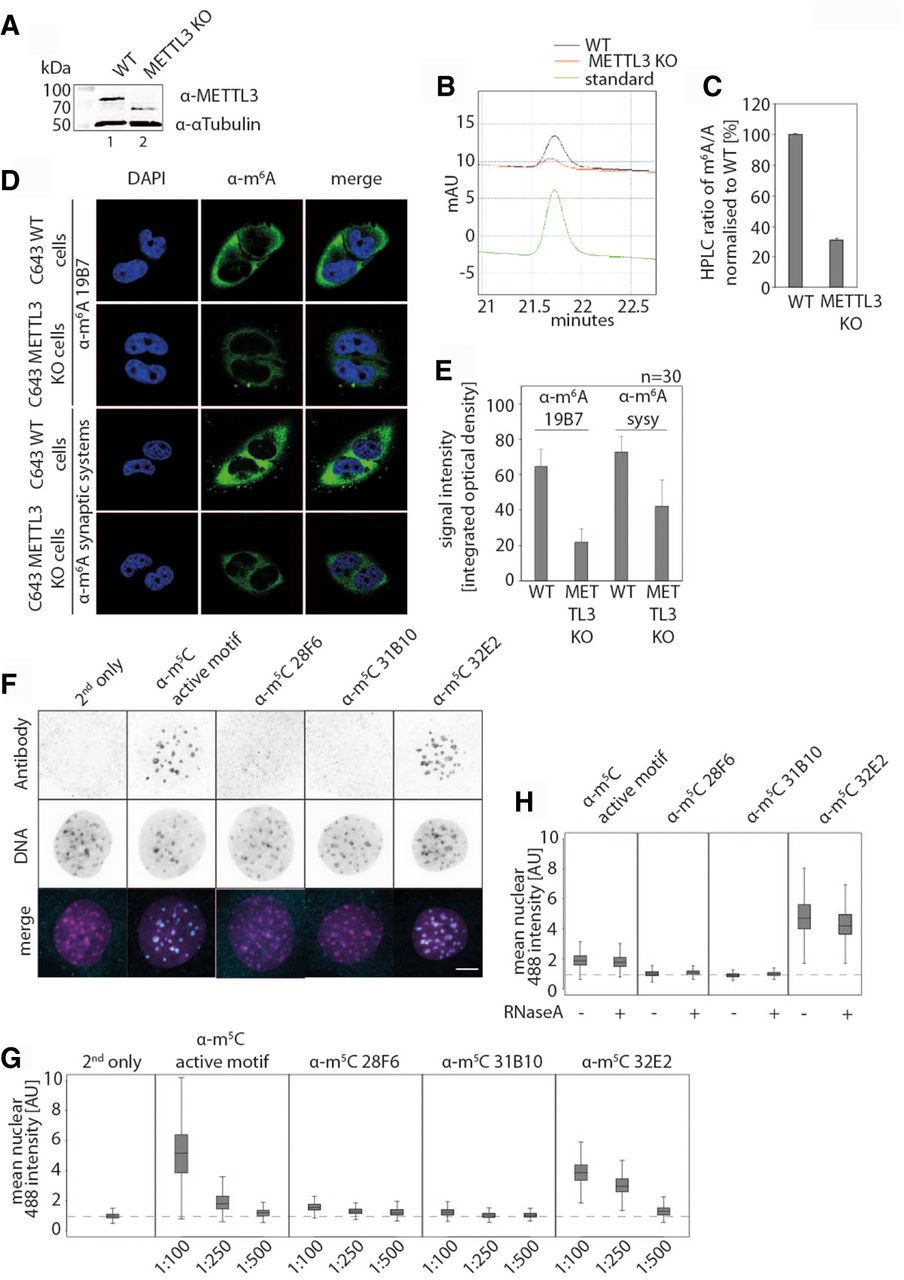
Immunofluorescence stainings of C643 wild-type (WT) and METTL3 knockout (KO) cell lines using α-m6A antibodies and immunofluorescences of MTF cells stained with α-m5C clone 32E2 detecting genomic m5C. (A) Western blot analysis of C643 WT and METTL3 KO cell lysates, probed with antibodies against METTL3 and α-Tubulin as a loading control. (B) Verification of m6A levels in the mRNA of C643 cells of WT compared to METTL3 KO by HPLC measurements. (C) Integrated values from B were normalized to WT and are given in percentages. (D) Immunofluorescences of WT and METTL3 KO cells. The cells were stained with α-m6A 19B7 (upper part) and polyclonal α-m6A Synaptic Systems (lower part). The DAPI staining (blue) shows the nuclei of the cells; in green, the m6A signals are shown. The right panel displays merged stainings. (E) Quantification of the signal intensities of the immunofluorescence staining of WT and METTL3 KO cells shown in A. For quantification, 30 cells each were analyzed. (F) Exemplary pseudo-colored maximum confocal Z-projections of RNaseA treated mouse tail fibroblasts (MTFs), stained with the indicated m5C antibodies diluted 1:250. An Alexa Fluor 488 conjugated secondary antibody was used to visualize the primary antibodies. DNA was stained with DAPI (scale bar, 10 µm). (G) Boxplots showing the normalized mean nuclear Alexa Fluor 488 intensities. Nuclear levels were normalized against cells stained without any primary antibody (“second only”). The outcome of three tested antibody dilutions, 1:100, 1:250, 1:500, is shown (n > 15,000). The dashed line indicates the median of “second only” cells. (H) Boxplots showing the normalized mean nuclear levels of Alexa Fluor 488 in MTF cells treated with or without RNaseA and stained with an antibody dilution of 1:250 (n > 40,000). Signal levels of Alexa Fluor 488 were normalized against control cells that were only stained with the secondary antibody. The dashed line indicates the median of cells, stained without primary antibody.




