


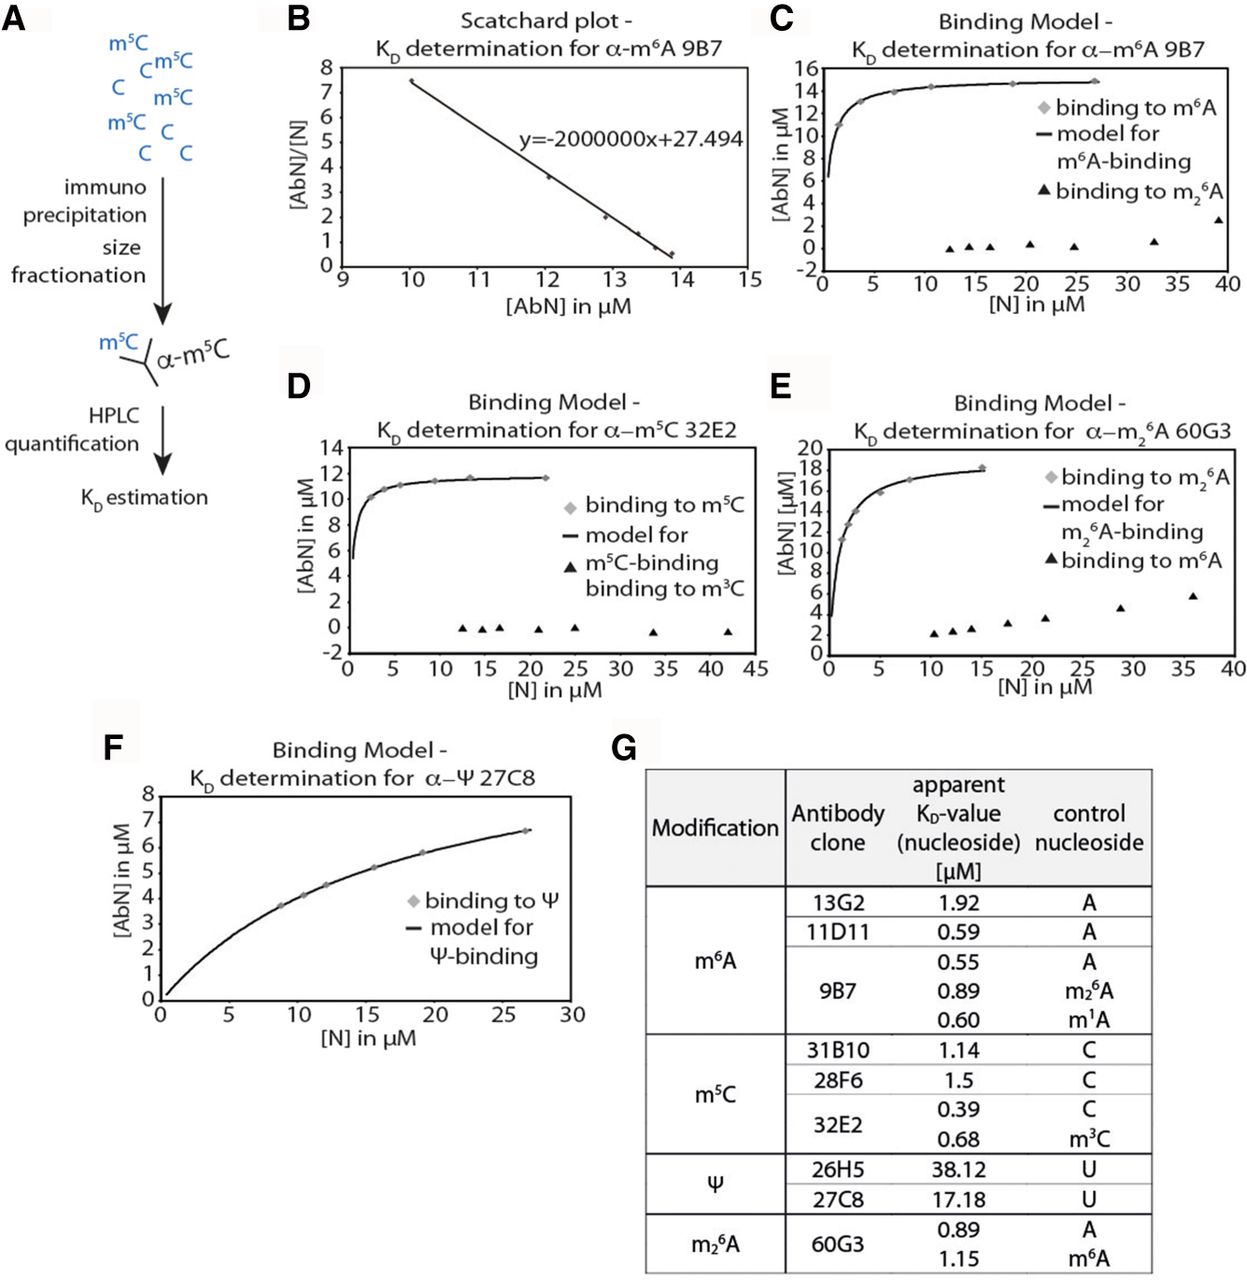
Determination of KD-values of antibodies against base modifications. (A) Schematic outline of the experiment to determine KD values of the antibodies. An equimolar mixture of modified and unmodified nucleotides was incubated with the respective antibodies tested and centrifugated through a filter with a cutoff, allowing free nucleotides but not nucleoside-antibody complexes to pass through. HPLC quantification of bound and unbound nucleosides were used for KD estimation. (B) Example for a Scatchard plot for antibody α- m6A 9B7. (C) Binding model for antibody m6A 9B7 shows the slow convergence toward saturation of the antibody binding capacity for the binding to m6A nucleosides (gray squares). The black triangles depict the binding to m26A nucleosides. (D) Binding model of antibody m5C 32E2, showing binding to m5C nucleosides (squares) and to m3C (triangles). (E) Estimation of the KD-value for antibody m26A 60G3, using a binding model based on m26A (squares) or m6A nucleoside binding (triangles). (F) The binding model for α-Ψ antibody 27C8 was performed as described using Ψ nucleosides. For additional Scatchard plots and binding models for the antibody KD-values listed in Figure 2G, see Supplemental Figure 1. (G) Overview of the KD-values of the different tested antibody clones against m6A, m5C, Ψ, and m26A. The last row indicates the respective nucleoside that was used for estimating the KD-value.




