


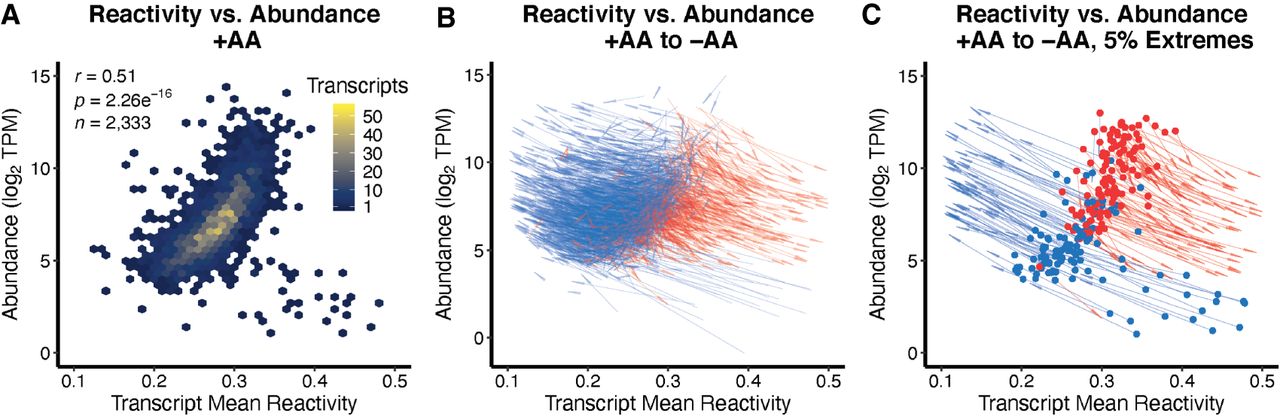
Average DMS reactivity positively correlates with transcript abundance. (A) The mean transcript reactivity is positively correlated to transcript abundance in +AA conditions, such that more reactive, accessible transcripts tend to be more abundant (r = 0.51, P < 2.26 × 10⁻¹⁶). (B) All transcripts resolved in both ±AA conditions are plotted as an arrow originating at the reactivity and abundance (log2 TPM) of each respective transcript's +AA values, and ending at that transcripts −AA reactivity and abundance values. (C) A subset of B, limiting the data to the top 5% largest increases and decreases of transcript abundance for better visualization. Arrow lines show where DMS reactivity decreased (blue) or increased (red) from +AA to −AA, while arrow origins show where abundance decreased (red) or increased (blue) from +AA to −AA.




