


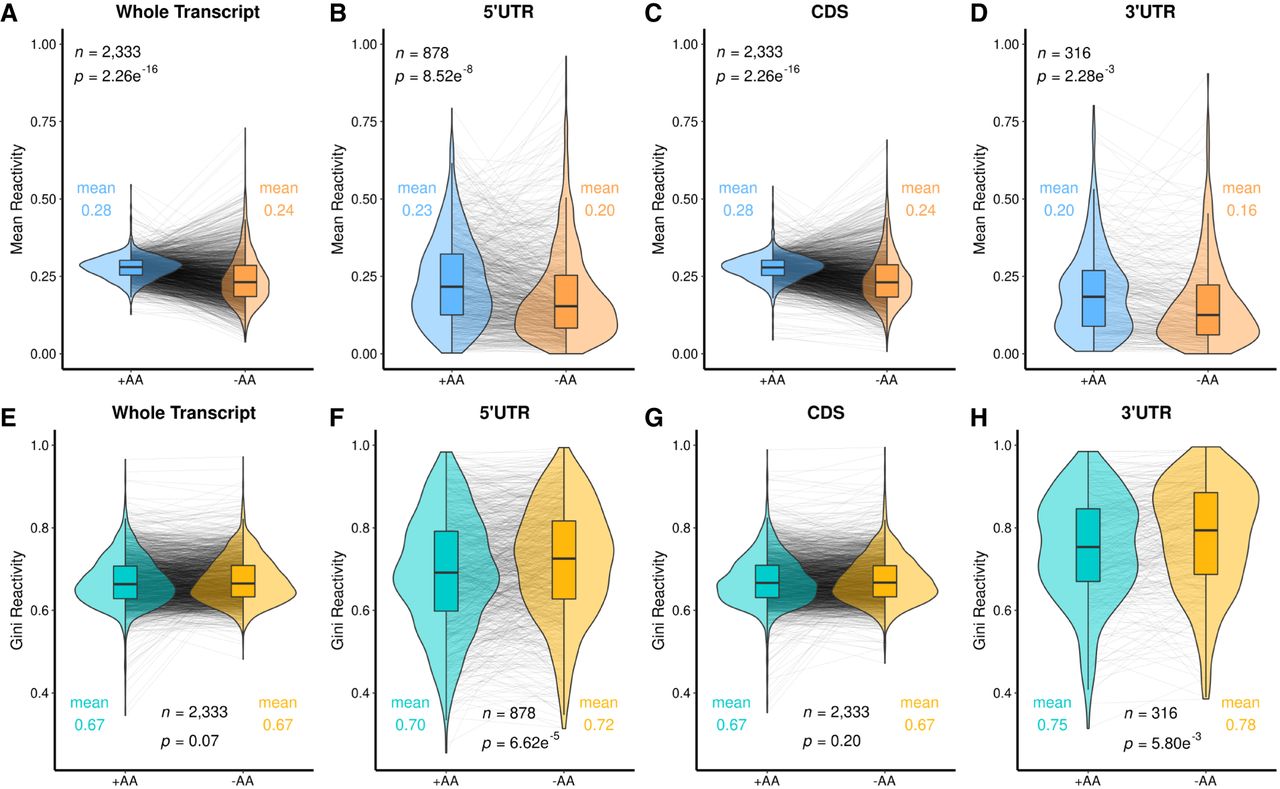
Amino acid starvation leads to lower DMS reactivity in all parts of transcripts, and increased Gini in the untranslated regions. (A) The distribution of mean transcript reactivities of the +AA transcriptome (teal) is compared to that of the −AA transcriptome (orange) on violin plots to show the overall distribution with a box plot at the center. Changes of individual transcripts are shown as gray lines. Most transcripts were less reactive when grown without amino acids. The overall means were compared via a t-test with the P-value reported in each panel. (B–D) 5′UTR, CDS, and 3′UTR respective regions following the same formatting as A. (E–H) Mirrors of A–D, but for the Gini coefficient of DMS reactivity rather than for the mean, between ±AA transcriptomes. A table of these t-tests can be found in Supplemental Table T.2




