


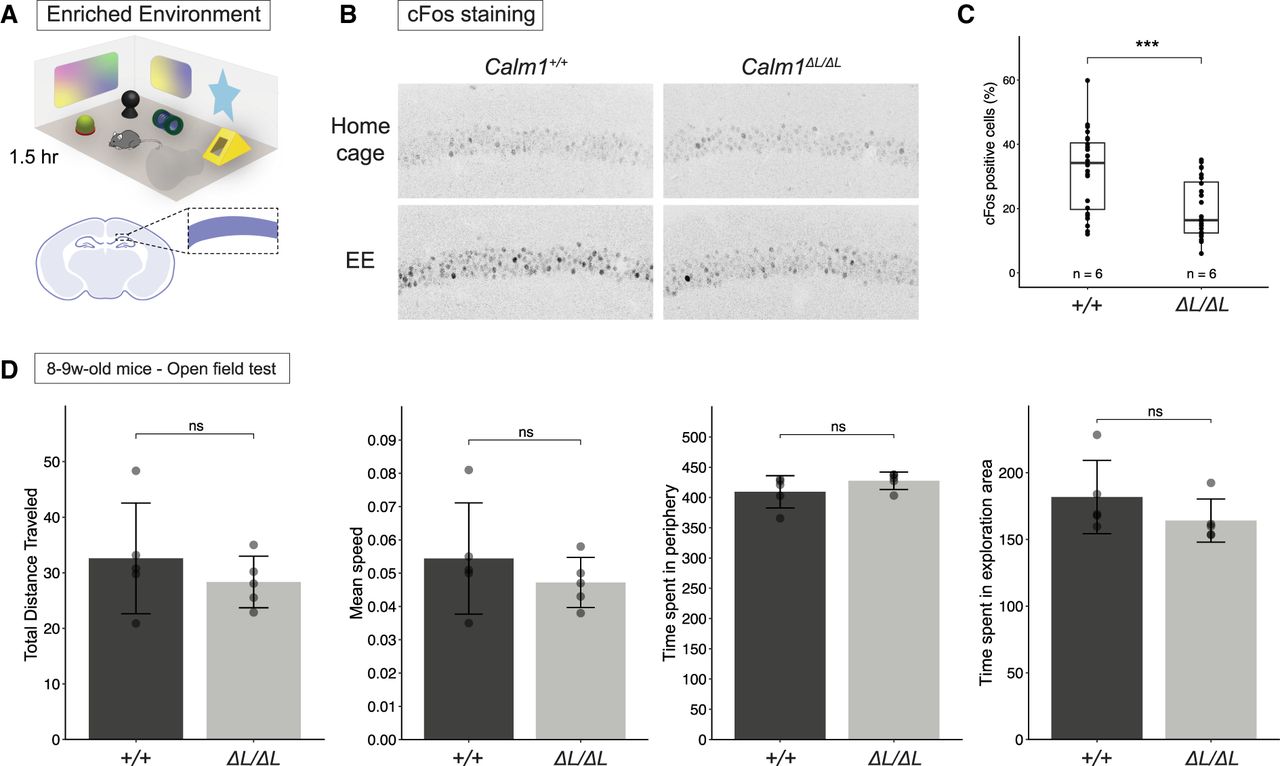
Calm1-L loss reduces hippocampal IEG expression in response to enriched environment exposure. (A) Graphic illustration of enriched environment used in this study and the CA1 region shown in B. (B) Representative images showing EE-induced expressions of cFos in Calm1+/+ and Calm1ΔL/ΔL CA1. (C) Percentages of cFos-positive cells in whole CA1 region was quantified in FIJI/ImageJ. Significance was determined using a t-test, (***) P < =0.001. n = 6 mice (two hemispheres in two brain sections for each mouse). (D) Levels of total distance traveled, mean speed, time spent in periphery and exploration areas of Calm1+/+ and Calm1ΔL/ΔL mice were compared using open field test. Significance was determined using a t-test in n = 5 mice; ns: P > 0.05.




