


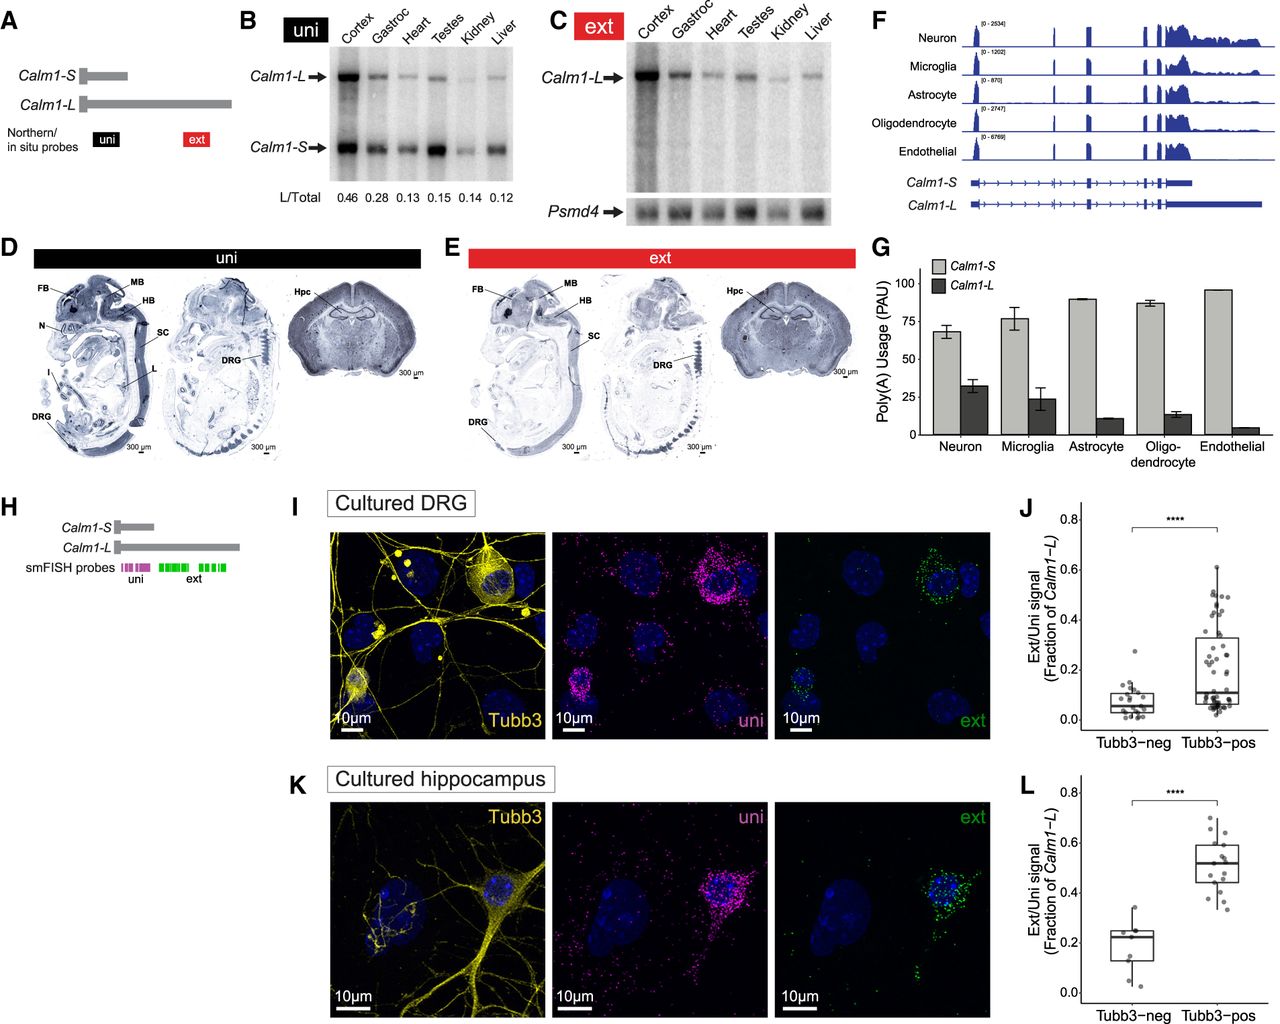
Calm1-L expression is enriched in neurons. (A) Diagram showing northern blot and DIG in situ probes to detect either both isoforms (uni) or specifically the long 3′-UTR isoform (ext). (B) Northern blot of an array of tissues collected from adult mice probed with uni probes showing Calm1-S (bottom arrow) and Calm1-L (top arrow). The ratio of Calm1-L normalized to total Calm1 (sum of Calm1-S band intensity and Calm1-L) is shown. (C) Northern blot performed with ext probe. The same blot was stripped and reprobed for the housekeeping gene Psmd4 as a loading control. (D) DIG in situ hybridization of E13.5 embryo and 8w brain using the uni probe showed universal expression of Calm1 showing strong signal in the nervous system including forebrain (FB), midbrain (MB), hindbrain (HB), spinal cord (SC), dorsal root ganglion (DRG), cortex, and hippocampus (Hpc). (E) DIG in situ performed with the ext probe showed neural tissue-specific expression pattern of Calm1-L with particularly strong signals in the DRG and Hpc. (F) RNA-seq tracks from purified neurons, microglia, astrocytes, newly formed oligodendrocytes, and endothelial cells are visualized. Calm1-L gene model is shown as annotated and Calm1-S gene model was illustrated based on the sequencing read coverages. Read coverage in the long 3′-UTR is particularly high in neurons. (G) QAPA was used to estimate the fraction of Calm1-S and Calm1-L found in each RNA-seq data set. The poly(A) usage indicates that Calm1-L is indeed enriched in neurons. Two replicates for each cell type. (H) Diagram showing RNAscope smFISH probe locations. (I,J) smFISH performed for total Calm1 (uni) or Calm1-L (ext) transcripts in primary DRG culture colabeled with β3 Tubulin (Tubb3) neuronal marker. Most cells showed robust uni signals while ext signals were restricted in Tubb3-positive cells. Significance was determined using a t-test, (****) P < =0.0001. n = 58 Tubb3-pos cells, n = 23 Tubb3-neg cells. (K,L) smFISH performed in primary hippocampal culture showing the same trend. Significance was determined using a t-test, (****) P < =0.0001. n = 17 Tubb3-pos cells, n = 9 Tubb3-neg cells.




