


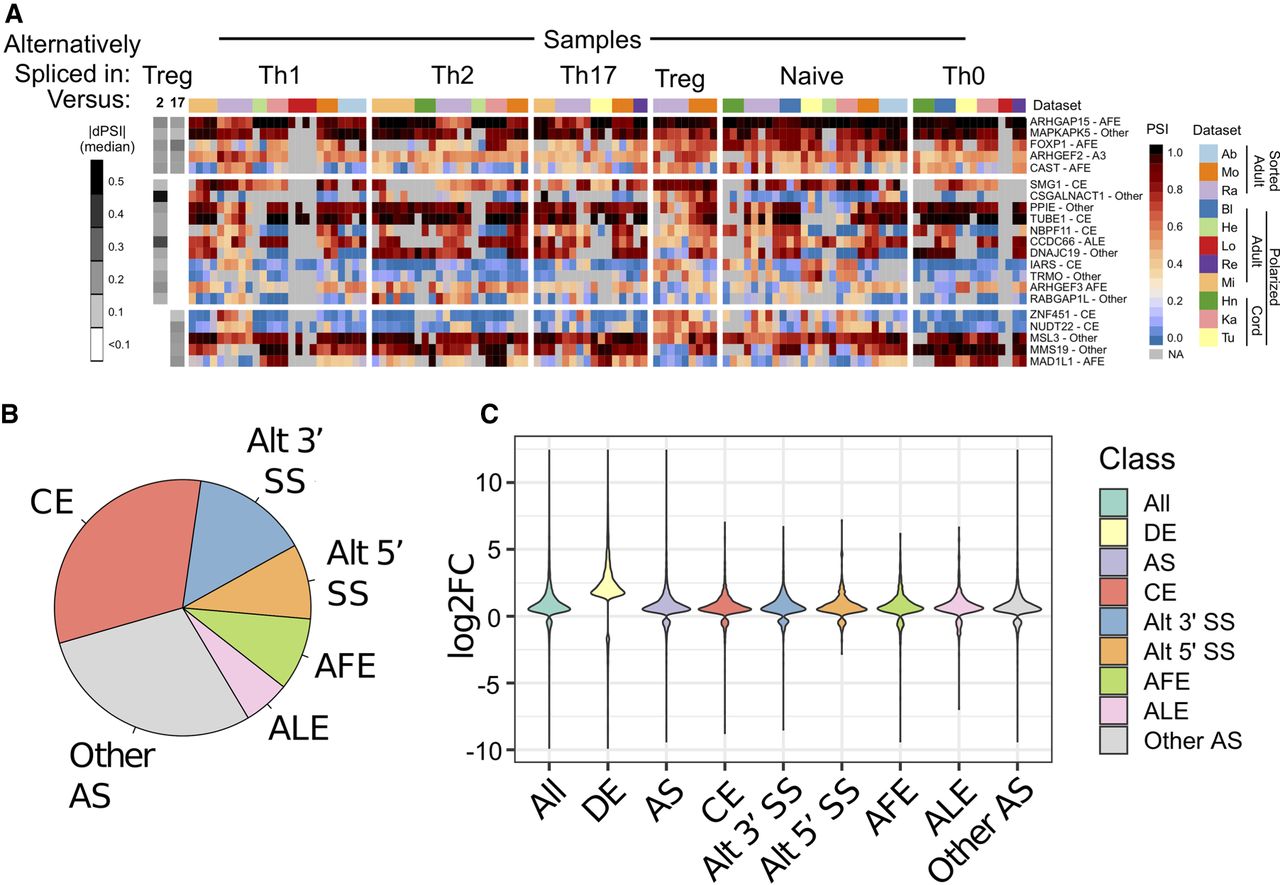
Only a limited number of splicing events are consistently regulated in a subset-specific manner in T cells. (A) Heatmap of PSI value for splicing events that show reproducible differences between Treg cells and Th2 and/or Th17 cells. Each column is a sample, and samples are grouped by cell type and author. Gene names and splicing event are on the right. Gray boxes in the heatmap indicate splicing events that lacked sufficient RNA-seq read depth to accurately quantify PSI. Grayscale boxes in the leftmost segment indicate comparisons that met significance threshold. The median dPSI of significant differences between the given subtype over others is quantified by the grayscale of the boxes (darker indicates higher dPSI). Significant differences are based on comparison between samples from the same data set (Ra and Mo have Treg), but PSI values are shown for all samples. (B) Pie chart of splicing events identified as differentially spliced between all T Helper subset comparisons. Categories include cassette exons (CE), alternative first exons (AFE), alternative 3′ss (Alt3′ss), alternative last exon (ALE), or alternative 5′ss (Alt5′ss), or other nondefined patterns of splicing (Other AS). (C) Change in expression (Log2FC) in all genes that are differentially expressed (DE) or alternatively spliced (AS) between two cell subtypes studies as compared to all genes (ALL). The change in expression of each type of splicing event is also shown as for B.




