


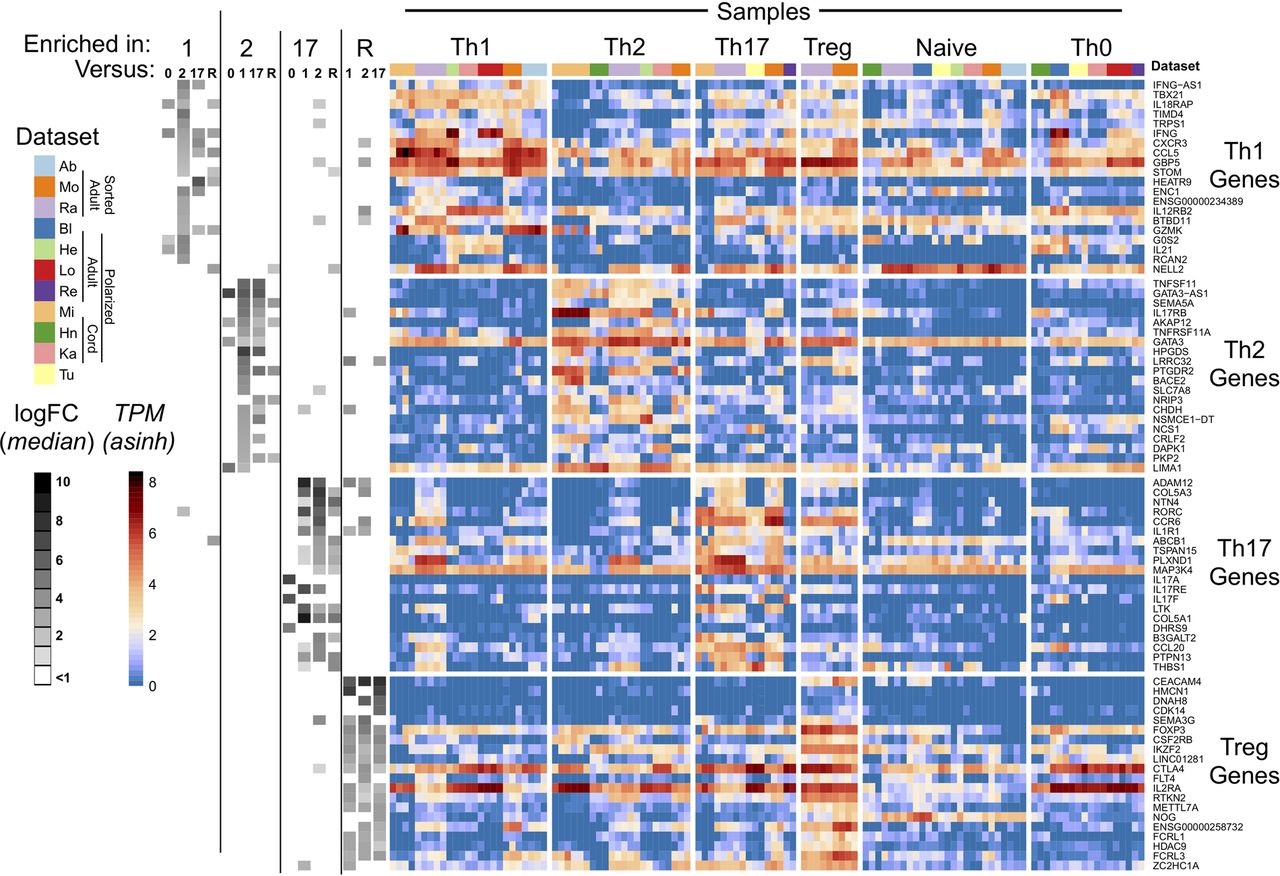
T cells consistently express core set of genes in a subset-specific manner. Reliably expressed T Helper genes (as defined in Materials and Methods), ranked by number of supporting data sets and log2FC differences. The heatmap shows inverse hyperbolic sine (asinh)-transformed TPMs. Each column is a sample, and samples are grouped by cell type and author. Gene names are on the right. Grayscale boxes in the leftmost segment indicate whether a given core T Helper gene was reliably more highly expressed in a given subset over others. The median logFC between the given subtype over others is quantified by the grayscale of the boxes (darker indicates higher logFC). All differential expression analyses were performed between samples from the same data set. The data sets with Treg samples lacked Th0 samples, so there is no “enriched in Treg vs. Th0” column.




