


FIGURE 3.
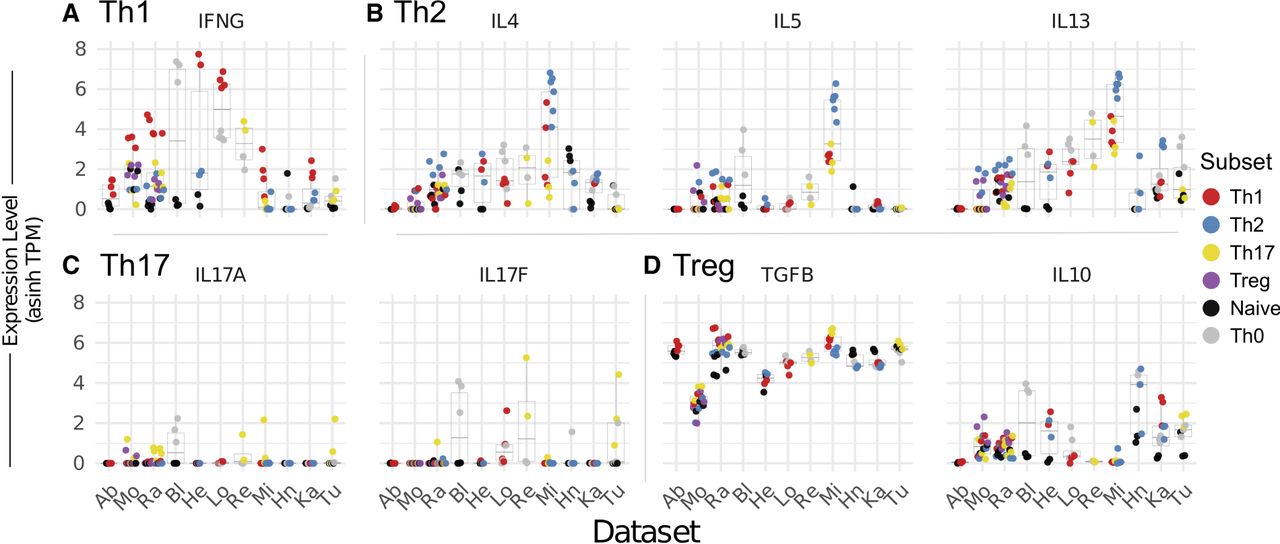
Expression of cytokines across T-cell subsets. Expression of cytokines associated with (A) Th1, (B) Th2, (C) Th17, or (D) Treg cells, across all data sets. Each plot represents a distinct gene, while each column is a distinct study. Studies are listed at bottom and ordered as in Figure 1A. For each study, the mean and distribution of the given gene is displayed as a box plot, with the values for each individual sample represented as a dot. Dots are colored by cell subtype. Note that not all studies contain all cell types, as described in Figure 1A. Expression values shown as the inverse hyperbolic sine (asinh) of transcripts per million (TPM).




