


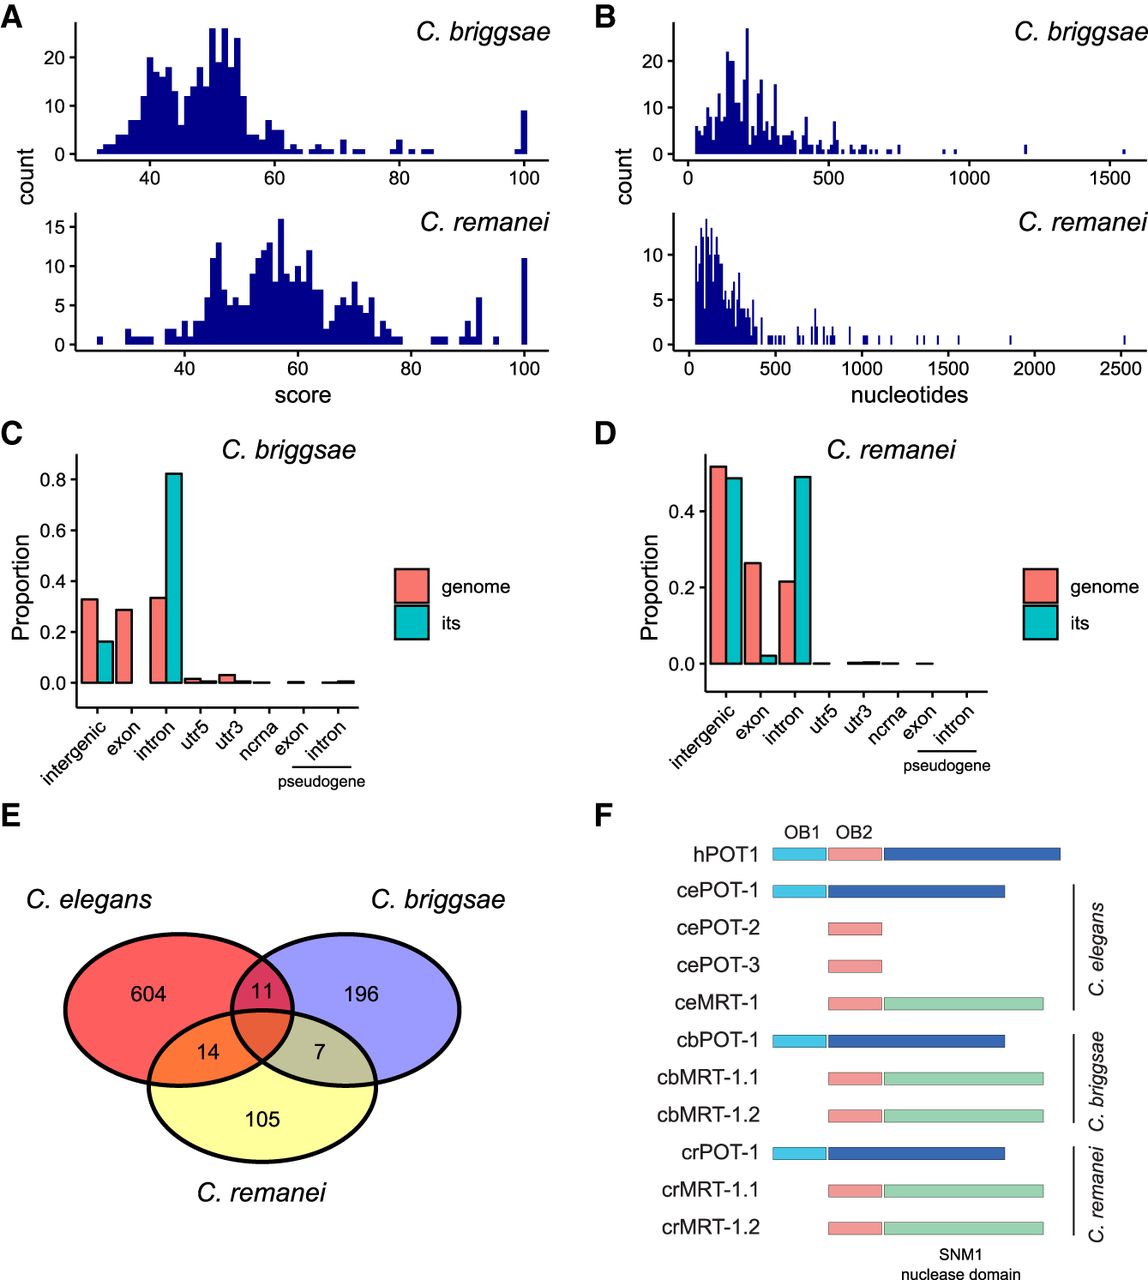
FIGURE 4.
ITS sites in C. briggsae and C. remanei. (A) Distribution of ITS scores. (B) Distribution of ITS lengths. (C) Proportion of ITS sites overlapping different genome features (blue bars) and amount of genomic space taken up by genomic features (pink). (D) As (C) but for C. remanei. (E) Number of genes for which orthologous genes in two species containing intronic ITS sites in both species. (F) Domain structures of C. elegans, C. briggsae, and C. remanei human POT1 homologs.




