


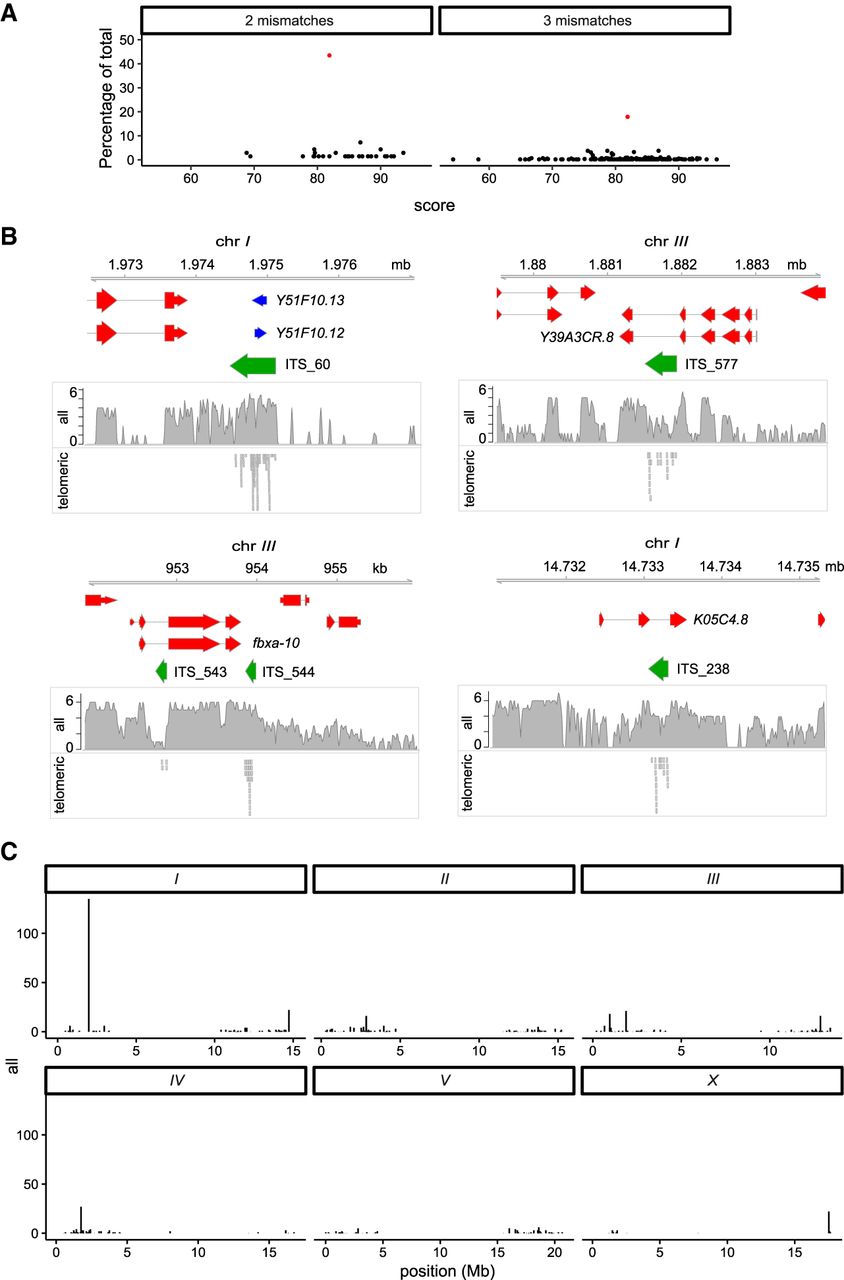
FIGURE 3.
Telomeric small RNAs map to ITS sites. (A) Scatter plots showing ITS score versus uniquely mapping small telomeric small RNAs count as a percentage of total abundance for each category for ITS sites with at least one small RNA read. ITS_60 is shown in red. (B) Genome track showing the top four ITSs with the highest uniquely mapping telomeric small RNA count. Total small RNA coverage and telomeric small RNA reads are shown as separate tracks (C) Genome-wide distribution of ITS sites. Y-axis shows uniquely binding telomeric small RNA count.




