


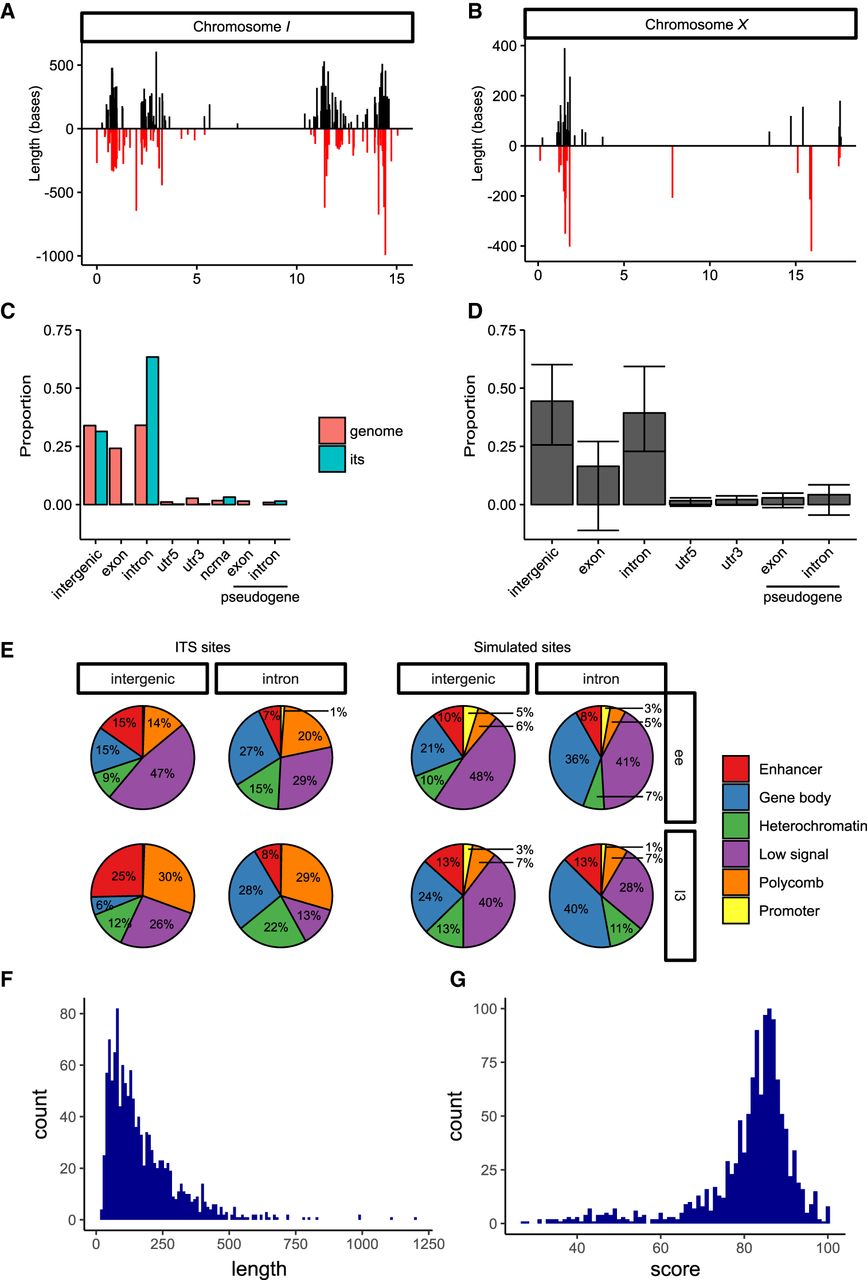
Characterization of ITSs in C. elegans. (A) Localization of ITS sites on chromosome I regions in the sense orientation (TTAGGC) are shown in black, antisense in red. (B) Localization of ITS sites on the X chromosome. (C) Proportion of ITS sites overlapping different genome features (blue bars) and amount of genomic space taken up by genomic features (pink). (D) Average proportion of features overlapped by hexanucleotide repeat sequences from 1000 simulations. Error bars show standard deviation. (E) Percentage of real or permuted (“simulation”) ITS sites that are covered by a particular chromatin state. Distributions of ITS length (F) and homology score (G).




